 I need questions 1-3 & 6-10 answered with shown calculated
work.
I need questions 1-3 & 6-10 answered with shown calculated
work.
4. Fill in the missing values in the table below: 16.200 4,050 32.39 b. 72.60 471.30 c. 1,427 d. 411.6 59.78 5. A sociologist studying work and organizations hypothesizes that part of the variance in employees' work satisfaction can he attributed to its linear regression on variety of work responsibilities. Data from 42 employees produced SSERROR .500 and s-175 for the dependent variable. Compute R for this bivariate equation and test whether this value is statistically different from zero at a01. Display your findings in an ANOVA-type format and state your decision. 6. If byx 1.1. sx 08, and sy 0.9, what do rxy and Rix equal? 7. Suppose a social psychologist collects the following data from five subjects: their scores on a test measuring the extent to which they trust other people and the number of altruistic acts they performed in the last month. Creale a bivariate regression equation for these variables. treating altruistic acts as the dependent variable. Subject Trust 70 85 Altruistic Acts 12 64 79 For the data in question 7, calculate the correlation coefficient, the coefficient of determination, and the coefficient of nondetermination. What can you conclude? 8. 9. If N-31, byx L.4. and s,60. test the null hypothesis that b-0 in the population, using a one-tailed test with a 05
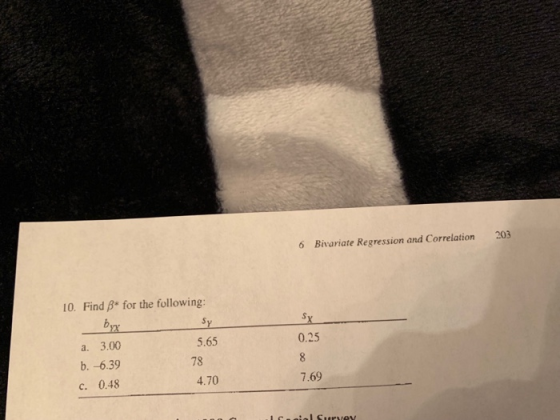
203 Bivariate Regression and Correlation 6 Find B* for the following: 10. 0.25 5.65 78 4.70 a. 3.00 b.-6.39 c. 0.48 7.69
Homework Answers

Add Answer to:
201 Bivariate Regression and Correlation 6 PROBLEMS General Problems 1. For the following data on...
14) Fill in the Blank. You run a regression analysis on a bivariate set of data...
 14) Fill in the Blank. You run a regression analysis on a bivariate set of data (n=25). With x(x-bar) -58.2 and "y=42.5 (y- bar), you obtain the regression equation yly-hat) - 3.111x-23.245 with a correlation coefficient of r=-0.095. You want to predict what value (on average) for the response variable will be obtained from a value of 50 as the explanatory variable. What is the best predicted response value, ya = ? Report answer accurate to one decimal place. Fill...
Topic: Linear Regression and Correlation In the table offered the data related to: Income Activities 1,250...
Topic: Linear Regression and Correlation In the table offered the data related to: Income Activities 1,250 35 1,400 38 1.375 31 1,825 45 1,175 20 1,740 39 I. With the biweekly income variables and number of activities carried out by 6 people; find and analyze: a) Linear dispersion diagram? d) Correlation coefficient? c) Perform a null hypothesis test that the correlation coefficients Linear in the universe are not significantly different from zero. Present the six steps learned, with a significance...
Topic: Linear Regression and Correlation In the table offered the data related to: Income Activities 1,250...
Topic: Linear Regression and Correlation In the table offered the data related to: Income Activities 1,250 35 1,400 38 1.375 31 1,825 45 1,175 20 1,740 39 I. With the biweekly income variables and number of activities carried out by 6 people; find and analyze: a) Linear dispersion diagram? b) Correlation coefficient? c) Perform a null hypothesis test that the correlation coefficients Linear in the universe are not significantly different from zero. Present the six steps learned, with a significance...
A sociologist was hired by a large city hospital to investigate the relationship between the number...
A sociologist was hired by a large city hospital to investigate the relationship between the number of unauthorized days that employees are absent per year and the distance (miles) between home and work for the employees. A sample of 6 employees was chosen, and the following data were collected. Distance to work (miles) 1 3 4 6 8 10 Number of days absent 8 5 8 7 6 3 a. Which variable is the independent variable? Which variable is the...
please show work 1. Regression and Correlation An experiment was conducted to study the effect of...
 please show work
1. Regression and Correlation An experiment was conducted to study the effect of increasing the dosage of a on sleeping time. Three readings were made at each of three dose levels certain barbiturate Sleeping Time (Hours) Dosage (11 μM/kg) 4 10 10 9 15 15 15 13 9 ΣΥ-642, ΣXY = 780 2X 84, ΣΧ2 1002, ΣΧΥ 780 ΣΥ-72, a. Plot the scatter Diagram b. Determine the Correlation Coefficient "r" and the coefficient of determination "R2n c....
please show work
1. Regression and Correlation An experiment was conducted to study the effect of increasing the dosage of a on sleeping time. Three readings were made at each of three dose levels certain barbiturate Sleeping Time (Hours) Dosage (11 μM/kg) 4 10 10 9 15 15 15 13 9 ΣΥ-642, ΣXY = 780 2X 84, ΣΧ2 1002, ΣΧΥ 780 ΣΥ-72, a. Plot the scatter Diagram b. Determine the Correlation Coefficient "r" and the coefficient of determination "R2n c....
1) Data was gathered from several professional golfers in order to determine if there is a...
 1)
Data was gathered from several professional golfers in order to
determine if there is a relationship between average driving
distance (in yards) and accuracy (in percentage). This data is
presented in the scatterplot below. Suppose we go on to compute the
correlation coefficient, r. In this example, the units of r would
be what?
A. There are no units
B. Yards
C. Percentage
D. Yards per percentage
E. Percentage per yard
2. In a study of academic achievement within...
1)
Data was gathered from several professional golfers in order to
determine if there is a relationship between average driving
distance (in yards) and accuracy (in percentage). This data is
presented in the scatterplot below. Suppose we go on to compute the
correlation coefficient, r. In this example, the units of r would
be what?
A. There are no units
B. Yards
C. Percentage
D. Yards per percentage
E. Percentage per yard
2. In a study of academic achievement within...
Place your answers on the templates provided. Show your work. Directions: 1. A doctor knows that muscle mass decreases with age. To help him understand this relationship in women, the doct...
 Place your answers on the templates provided. Show your work. Directions: 1. A doctor knows that muscle mass decreases with age. To help him understand this relationship in women, the doctor selected women beginning with age 40 and ending with age 80. The data is given in the table below. x is age, y is a measure of muscle mass (the higher the measure, the more muscle mass). Use your calculator to make a scatter plot that shows how age...
part 1 is done need help with part 2 please Regression and Correlation Part 1 -Hypothesis...
 part 1 is done need help with part 2 please
Regression and Correlation Part 1 -Hypothesis test for u a) Use the data provided Perform a complete hypothesis test (show all steps) of Ho: 4 = 42 Use a -.05 Word your conclusion clearly in plain English so that a 14-year-old would understand it. For this part of the assignment, we'll look to see if there's an association between the responses of your two numerical questions PART 2 - Regression...
part 1 is done need help with part 2 please
Regression and Correlation Part 1 -Hypothesis test for u a) Use the data provided Perform a complete hypothesis test (show all steps) of Ho: 4 = 42 Use a -.05 Word your conclusion clearly in plain English so that a 14-year-old would understand it. For this part of the assignment, we'll look to see if there's an association between the responses of your two numerical questions PART 2 - Regression...
Question # 3. The following data set records the cost of advertising (in thousands of dollars)...
Question # 3. The following data set records the cost of advertising (in thousands of dollars) and the number of prescriptions written for a new drug (in thousands). Cost (x) 9 2 3 4 2 6 9 10 Number of prescriptions (y) 85 61 64 67 60 75 83 87 Using the above data: (Please use Minitab for parts a, b, d) a) A bivariate (scatter) plot for the data set. (5 points) b) Find the correlation (r) and its...
Problem 5- Simple Linear Regression The following data represent the number of flash drives sold per...
 Problem 5- Simple Linear Regression The following data represent the number of flash drives sold per day at a local computer shop and their prices Price $34 36 32 35 30 Units Sold 6 40 A computer output is produced to examine this relationship further SUMMA RY OUTPUT Regression Statistics Multiple R RSquare Adjusted R Square Standard Error Observations 0.924982 0.855592 0.826711 1.119949 7 ANOVA MS gnificance F Regression Residual Total 137.15714 37.15714 29.62415 0.002842 5 б,271429 1.254286 6 43.42857...
 14) Fill in the Blank. You run a regression analysis on a bivariate set of data (n=25). With x(x-bar) -58.2 and "y=42.5 (y- bar), you obtain the regression equation yly-hat) - 3.111x-23.245 with a correlation coefficient of r=-0.095. You want to predict what value (on average) for the response variable will be obtained from a value of 50 as the explanatory variable. What is the best predicted response value, ya = ? Report answer accurate to one decimal place. Fill...
 please show work
1. Regression and Correlation An experiment was conducted to study the effect of increasing the dosage of a on sleeping time. Three readings were made at each of three dose levels certain barbiturate Sleeping Time (Hours) Dosage (11 μM/kg) 4 10 10 9 15 15 15 13 9 ΣΥ-642, ΣXY = 780 2X 84, ΣΧ2 1002, ΣΧΥ 780 ΣΥ-72, a. Plot the scatter Diagram b. Determine the Correlation Coefficient "r" and the coefficient of determination "R2n c....
please show work
1. Regression and Correlation An experiment was conducted to study the effect of increasing the dosage of a on sleeping time. Three readings were made at each of three dose levels certain barbiturate Sleeping Time (Hours) Dosage (11 μM/kg) 4 10 10 9 15 15 15 13 9 ΣΥ-642, ΣXY = 780 2X 84, ΣΧ2 1002, ΣΧΥ 780 ΣΥ-72, a. Plot the scatter Diagram b. Determine the Correlation Coefficient "r" and the coefficient of determination "R2n c....
 1)
Data was gathered from several professional golfers in order to
determine if there is a relationship between average driving
distance (in yards) and accuracy (in percentage). This data is
presented in the scatterplot below. Suppose we go on to compute the
correlation coefficient, r. In this example, the units of r would
be what?
A. There are no units
B. Yards
C. Percentage
D. Yards per percentage
E. Percentage per yard
2. In a study of academic achievement within...
1)
Data was gathered from several professional golfers in order to
determine if there is a relationship between average driving
distance (in yards) and accuracy (in percentage). This data is
presented in the scatterplot below. Suppose we go on to compute the
correlation coefficient, r. In this example, the units of r would
be what?
A. There are no units
B. Yards
C. Percentage
D. Yards per percentage
E. Percentage per yard
2. In a study of academic achievement within...
 Place your answers on the templates provided. Show your work. Directions: 1. A doctor knows that muscle mass decreases with age. To help him understand this relationship in women, the doctor selected women beginning with age 40 and ending with age 80. The data is given in the table below. x is age, y is a measure of muscle mass (the higher the measure, the more muscle mass). Use your calculator to make a scatter plot that shows how age...
 part 1 is done need help with part 2 please
Regression and Correlation Part 1 -Hypothesis test for u a) Use the data provided Perform a complete hypothesis test (show all steps) of Ho: 4 = 42 Use a -.05 Word your conclusion clearly in plain English so that a 14-year-old would understand it. For this part of the assignment, we'll look to see if there's an association between the responses of your two numerical questions PART 2 - Regression...
part 1 is done need help with part 2 please
Regression and Correlation Part 1 -Hypothesis test for u a) Use the data provided Perform a complete hypothesis test (show all steps) of Ho: 4 = 42 Use a -.05 Word your conclusion clearly in plain English so that a 14-year-old would understand it. For this part of the assignment, we'll look to see if there's an association between the responses of your two numerical questions PART 2 - Regression...
 Problem 5- Simple Linear Regression The following data represent the number of flash drives sold per day at a local computer shop and their prices Price $34 36 32 35 30 Units Sold 6 40 A computer output is produced to examine this relationship further SUMMA RY OUTPUT Regression Statistics Multiple R RSquare Adjusted R Square Standard Error Observations 0.924982 0.855592 0.826711 1.119949 7 ANOVA MS gnificance F Regression Residual Total 137.15714 37.15714 29.62415 0.002842 5 б,271429 1.254286 6 43.42857...
Most questions answered within 3 hours.
-
You draw and keep a single bill from a hat that contains a
$11, $55, $20...
asked 6 minutes ago -
Write a Java program that has the following methods:
findSum - a method that takes in...
asked 7 minutes ago -
A coffee cup calorimeter initially contains 135g of water at
22.0oC. Calcium chloride (21.0g) at the...
asked 11 minutes ago -
A patient is having a magnetic resonance imaging scan (an MRI)
and has neglected to remove...
asked 13 minutes ago -
A student takes a multiple-choice test that has 10 questions.
Each question has two choices. The...
asked 37 minutes ago -
Willie Keeler has a lifetime batting average of 0.341. Assume
that Willie Keeler came to bat...
asked 39 minutes ago -
Which of the following has the highest boiling point?
A) 0.5m NaCl
B) 0.5m C6H12O6
C)...
asked 58 minutes ago -
12. A firm is producing at an output level where
AR = MC > AC >...
asked 55 minutes ago -
Radovilsky Manufacturing Company, in Hayward, California,
makes flashing lights for toys. The company operates its production...
asked 58 minutes ago -
As an athlete exercises, sweat is produced and evaporated to
jelp maintain a proper body temperature....
asked 57 minutes ago -
Which of these macromolecules is most prevalent (by mass) in the
environment? What particular challenge does...
asked 59 minutes ago -
Consider two stocks. Stock A has a standard deviation of 46% and
stock B has a...
asked 1 hour ago