
Homework Answers
Add Answer to:
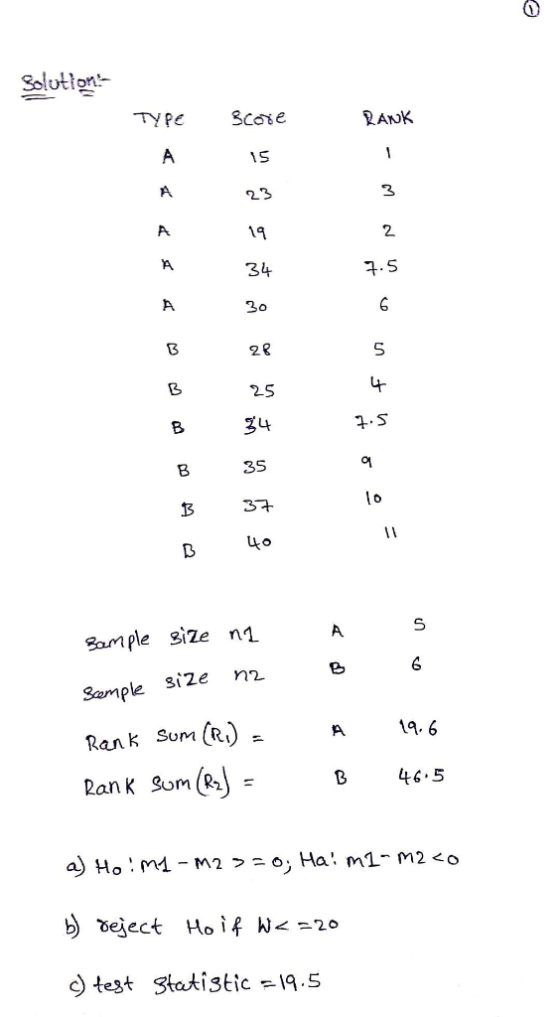
The following data were drawn from two independent populations. Sample 1 Sample 2 15 23 19 3430 2...
The following data were drawn from two independent populations. Sample 1 14, 21, 17, 35, 32,...
The following data were drawn from two independent populations. Sample 1 14, 21, 17, 35, 32, Sample 2 28, 23, 31, 36, 34, 40 a. Specify the competing hypotheses to determine whether the median of Population 1 is less than the median of Population 2. H0: m1 − m2 = 0; HA: m1 − m2 ≠ 0 H0: m1 − m2 ≤ 0; HA: m1 − m2 > 0 H0: m1 − m2 ≥ 0; HA: m1 − m2 <...
Random samples were drawn from three independent populations. The results are shown in the accomp...
 Random samples were drawn from three independent populations. The results are shown in the accompanying table. Use Table 3. Sample 1 12 95 115 110 9 Sample 2 10 85 105 80 75 90 Sample 3 72 65 10 76 66 55 a. Specify the competing hypotheses to test whether some differences exist between the medians. He: m-23HA: Not all population medians are equal. оне: m1 Z m2 m3; MA: All population medians are equal. He: m 2 3 HA:...
Consider the following competing hypotheses and accompanying sample data drawn independently from normally distributed populations. (You...
 Consider the following competing hypotheses and accompanying sample data drawn independently from normally distributed populations. (You may find it useful to reference the appropriate table: z table or t table) Ho: H1-Hu2 0 HA: H1 Hz< e 251 252 s1 39 s=19 n1=7 n 7 a-1. Calculate the value of the test statistic under the assumption that the population variances are equal. (Negative values should be indicated by a minus sign. Round all intermediate calculations to at least 4 decimal...
A random sample of five observations from three normally distributed populations produced the following data: (You...
 A random sample of five observations from three normally distributed populations produced the following data: (You may find it useful to reference the F table.) Treatments A C 20 1 9 25 25 22 27 21 24 24 26 2.1 22 23 19 XR - 23 SR6.5 S 4.5 S 4.5 Click here for the Excel Data File f. At the 5% significance level, what is the conclusion to the test? Reject Ho since the p-value is less than significance...
Consider the following competing hypotheses and accompanying sample data (You may find it useful to reference...
 Consider the following competing hypotheses and accompanying sample data (You may find it useful to reference the appropriate table: z table or t table) Ho: Pi - P22 MA: P1 - P2 @ X1 - 238 nu - 425 X2 - 263 n2 - 425 a. Calculate the value of the test statistic (Negative value should be indicated by a minus sign. Round intermediate calculations to at least 4 decimal places and final answer to 2 decimal places.) Test statistic...
Independent random samples were selected from each of two normally distributed populations, n = 6 from...
 Independent random samples were selected from each of two normally distributed populations, n = 6 from population 1 and n2 = 5 from population 2. The data are shown in the table to the right. Complete parts a through c below. 4.7 4.6 1.6 2.3 1.2 3.8 0.6 3.9 C. Test Ho: 02202 against He:0; >o. Use a = 0.01. Determine the test statistic. F= (Round to two decimal places as needed.) Find the p-value. p= (Round to three decimal...
Consider the following competing hypotheses and accompanying sample data drawn independently from normally distributed populations. (You may find it useful to reference the appropriate table: z table or t table)
 Consider the following competing hypotheses and accompanying sample data drawn independently from normally distributed populations. (You may find it useful to reference the appropriate table: z table or t table) H0: μ1 − μ2 ≥ 0HA: μ1 − μ2 < 0 x¯1x¯1= 249x−2x−2= 262s1 = 35s2 = 23n1 = 10n2 = 10a-1. Calculate the value of the test statistic under the assumption that the population variances are equal. (Negative values should be indicated by a minus sign. Round all intermediate calculations to at least 4 decimal places and final answer to 3 decimal places.) a-2. Find the p-value. multiple choice 1p-value < 0.010.01 ≤ p-value...
Consider the following hypotheses H0 : μ-420 HA: 420 The population is normally distributed with a...
 Consider the following hypotheses H0 : μ-420 HA: 420 The population is normally distributed with a population standard deviation of 72. (You may find it useful to reference the appropriate table: z table or t table) a-1. Calculate the value of the test statistic with x = 430 and n= 90' (Round intermediate calculations to at least 4 decimal places and final answer to 2 decimal places.) Test statistic a-2. what is the conclusion at the 1% significance level? OReject...
Consider the following hypotheses: He: μ28e The population is normally distributed. A sample produces the following...
 Consider the following hypotheses: He: μ28e The population is normally distributed. A sample produces the following observations: 56 67 62 81 8366 Conduct the test at the 1% level of significance. (You may find lt useful to reference the appropriate table: table or Цеье o. Calculate the value of the test statistic. (Negative value should be Indicated by a minus sign. Round Intermedlate caleulatlons to at least 4 declmal places and final answer to 2 declmal places.) Test statistic b....
Consider the following data drawn independently from normally distributed populations: (You may find it useful to...
 Consider the following data drawn independently from normally distributed populations: (You may find it useful to reference the appropriate table: z table or t table) 21 = 29.8 012 - 95.3 nu = 34 22 = 32.4 oz? = 91.6 ng = 29 a. Construct the 99% confidence interval for the difference between the population means. (Negative values should be indicated by a minus sign. Round all intermediate calculations to at least 4 decimal places and final answers to 2...
 Random samples were drawn from three independent populations. The results are shown in the accompanying table. Use Table 3. Sample 1 12 95 115 110 9 Sample 2 10 85 105 80 75 90 Sample 3 72 65 10 76 66 55 a. Specify the competing hypotheses to test whether some differences exist between the medians. He: m-23HA: Not all population medians are equal. оне: m1 Z m2 m3; MA: All population medians are equal. He: m 2 3 HA:...
 Consider the following competing hypotheses and accompanying sample data drawn independently from normally distributed populations. (You may find it useful to reference the appropriate table: z table or t table) Ho: H1-Hu2 0 HA: H1 Hz< e 251 252 s1 39 s=19 n1=7 n 7 a-1. Calculate the value of the test statistic under the assumption that the population variances are equal. (Negative values should be indicated by a minus sign. Round all intermediate calculations to at least 4 decimal...
 A random sample of five observations from three normally distributed populations produced the following data: (You may find it useful to reference the F table.) Treatments A C 20 1 9 25 25 22 27 21 24 24 26 2.1 22 23 19 XR - 23 SR6.5 S 4.5 S 4.5 Click here for the Excel Data File f. At the 5% significance level, what is the conclusion to the test? Reject Ho since the p-value is less than significance...
 Consider the following competing hypotheses and accompanying sample data (You may find it useful to reference the appropriate table: z table or t table) Ho: Pi - P22 MA: P1 - P2 @ X1 - 238 nu - 425 X2 - 263 n2 - 425 a. Calculate the value of the test statistic (Negative value should be indicated by a minus sign. Round intermediate calculations to at least 4 decimal places and final answer to 2 decimal places.) Test statistic...
 Independent random samples were selected from each of two normally distributed populations, n = 6 from population 1 and n2 = 5 from population 2. The data are shown in the table to the right. Complete parts a through c below. 4.7 4.6 1.6 2.3 1.2 3.8 0.6 3.9 C. Test Ho: 02202 against He:0; >o. Use a = 0.01. Determine the test statistic. F= (Round to two decimal places as needed.) Find the p-value. p= (Round to three decimal...
 Consider the following hypotheses H0 : μ-420 HA: 420 The population is normally distributed with a population standard deviation of 72. (You may find it useful to reference the appropriate table: z table or t table) a-1. Calculate the value of the test statistic with x = 430 and n= 90' (Round intermediate calculations to at least 4 decimal places and final answer to 2 decimal places.) Test statistic a-2. what is the conclusion at the 1% significance level? OReject...
 Consider the following hypotheses: He: μ28e The population is normally distributed. A sample produces the following observations: 56 67 62 81 8366 Conduct the test at the 1% level of significance. (You may find lt useful to reference the appropriate table: table or Цеье o. Calculate the value of the test statistic. (Negative value should be Indicated by a minus sign. Round Intermedlate caleulatlons to at least 4 declmal places and final answer to 2 declmal places.) Test statistic b....
 Consider the following data drawn independently from normally distributed populations: (You may find it useful to reference the appropriate table: z table or t table) 21 = 29.8 012 - 95.3 nu = 34 22 = 32.4 oz? = 91.6 ng = 29 a. Construct the 99% confidence interval for the difference between the population means. (Negative values should be indicated by a minus sign. Round all intermediate calculations to at least 4 decimal places and final answers to 2...
Most questions answered within 3 hours.
-
Write a program to solve the Josephus problem, with the following
modification:
Sample Input:
./a.out n...
asked 5 minutes ago -
At the start of a CD it is spinning at a rate of 525 rpm
(revolutions...
asked 41 minutes ago -
4. Without doing any calculations, predict whether the observed
∆T would increase, decrease or remain the...
asked 1 hour ago -
Based on the range, which of the following sets of scores has
the greatest variability? 3,...
asked 3 hours ago -
Ripples in a pond travel at a velocity of 3 m/s with one peak
passing a...
asked 2 hours ago -
A man stands on the roof of a building of height 13.0 mm and
throws a...
asked 3 hours ago -
The extent to which assets are financed by borrowed funds and
other liabilities is indicated by:...
asked 4 hours ago -
Explain in detail
Germany is the fifth largest economy
explain what goods and services Germany specializes...
asked 4 hours ago -
The density of platinum is 21.45 g/mL. If a cube of platinum
with a mass of...
asked 4 hours ago -
Accounts Receivable
Sales
A/R Posting
Extended Sales Invoice
Packing Slip
Compare invoice to packing slip 2...
asked 4 hours ago -
Michaella, age 23, is a full-time law student and is claimed by
her parents as a...
asked 4 hours ago -
Why are polymers not typically casted into products?
asked 4 hours ago