(a), show steps for the pooled version of the test. You may use software to get the means and SDs. Give p-value range from table.
(b), do the pooled and unpooled versions with software; attach results; state conclusions.
(c), give a 95% CI for the difference between the means, using the pooled version.
Homework Answers
a) mean of online = 76.7500
mean of classroon = 73.7857
standard deviation of online = 8.5719
standard deviation of classroom = 9.2502
P_value = 0.4079
b) By using SAS

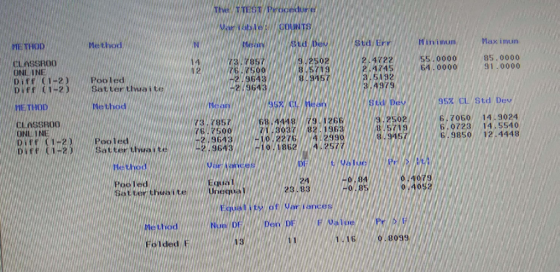
c) 90% Confidence interval for mean (-10.2276 , 4.2990)
Add Answer to:
(a), show steps for the pooled version of the test. You may use software to get the means and SDs...
Consider the below matrixA, which you can copy and paste directly into Matlab.
Problem #1: Consider the below matrix A, which you can copy and paste directly into Matlab. The matrix contains 3 columns. The first column consists of Test #1 marks, the second column is Test # 2 marks, and the third column is final exam marks for a large linear algebra course. Each row represents a particular student.A = [36 45 75 81 59 73 77 73 73 65 72 78 65 55 83 73 57 78 84 31 60 83...
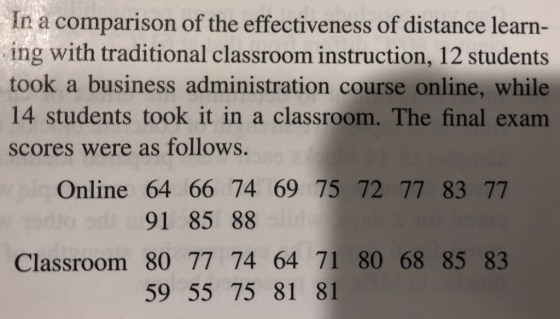
An experiment is conducted to determine if classes offered in an online format are as effective a...
An experiment is conducted to determine if classes offered in an online format are as effective as classes offered in a traditional classroom setting. Students were randomly assigned to one of the two teaching methods. Data below. a. Test the claim that the standard deviations for the two groups are equal. What is the p-value of the test? b. Construct a 95% confidence interval on the difference in expected final exam scores between the two groups. Does the data support...
1. Forecast demand for Year 4. a. Explain what technique you utilized to forecast your demand....
 1. Forecast demand for Year 4.
a. Explain what technique you utilized to forecast your
demand.
b. Explain why you chose this technique over others.
Year 3 Year 1 Year 2 Actual Actual Actual Forecast Forecast Forecast Demand Demand Demand Week 1 52 57 63 55 66 77 Week 2 49 58 68 69 75 65 Week 3 47 50 58 65 80 74 Week 4 60 53 58 55 78 67 57 Week 5 49 57 64 76 77...
1. Forecast demand for Year 4.
a. Explain what technique you utilized to forecast your
demand.
b. Explain why you chose this technique over others.
Year 3 Year 1 Year 2 Actual Actual Actual Forecast Forecast Forecast Demand Demand Demand Week 1 52 57 63 55 66 77 Week 2 49 58 68 69 75 65 Week 3 47 50 58 65 80 74 Week 4 60 53 58 55 78 67 57 Week 5 49 57 64 76 77...
Please compute your z -don't use a package State your conclusion in plain English - not...
 Please compute your z -don't use a package State your conclusion in plain English - not just rejection 1 Students in the online class are suspicious that their schools 60 point loss may have caused their teacher to take out his frustration on the students by giving them a harder than usual exam. They manage to hack into his computer and get the following data: Scores for test Nov 2011 71 74 64 77 58 72 73 79 50 78...
Use the accompanying data set on the pulse rates (in beats per minute) of males to...
Use the accompanying data set on the pulse rates (in beats per minute) of males to complete parts (a) and (b) below. LOADING... Click the icon to view the pulse rates of males. a. Find the mean and standard deviation, and verify that the pulse rates have a distribution that is roughly normal. The mean of the pulse rates is 71.871.8 beats per minute. (Round to one decimal place as needed.) The standard deviation of the pulse rates is 12.212.2...
Use the Grouped Distribution method for the following exercise (see Self-Test 2-4 for detailed instructions), rounding...
Use the Grouped Distribution method for the following exercise (see Self-Test 2-4 for detailed instructions), rounding each answer to the nearest whole number. Using the frequency distribution below (scores on a statistics exam taken by 80 students), determine:ion 1 of the preliminary test (scores on a statistics exam taken by 80 students), determine: 68 84 75 82 68 90 62 88 76 93 73 79 88 73 60 93 71 59 85 75 61 65 75 87 74 62 95...
The given data is the grades for people in this class. The goal here is to...
 The given data is the grades for people in this class. The goal here is to determine the factors that effect student's Grade in the class. 4) Find the mean and median for the men's and the women's Quizzes. Gender Men Women 5) Test the claim that the majority of students at this class are women. F M F F M F F F F M M F F F M F F F F M M F F M...
Question 9-15 are based on the random sample below which is obtained to test the following hypoth...
Question 9-15 are based on the random sample below which is obtained to test the following hypothesis about the population mean. Test the hypothesis that the mean is less than 80. 80 100 81 93 80 57 98 90 71 56 58 78 59 55 55 77 72 78 56 94 98 59 93 86 89 62 60 66 59 71 96 97 94 69 64 77 87 77 64 90 90 95 98 99 56 69 72 81 95...
Find the indicated measure. The test scores of 40 students are listed below. Find P85.
Find the indicated measure. The test scores of 40 students are listed below. Find P85. 30 35 43 44 47 48 54 55 56 57 59 62 63 65 66 68 69 69 71 72 72 73 74 76 77 77 78 79 80 81 81 82 83 85 89 92 93 94 97 98 1) 85 2) 87 3) 89 4) 34
 1. Forecast demand for Year 4.
a. Explain what technique you utilized to forecast your
demand.
b. Explain why you chose this technique over others.
Year 3 Year 1 Year 2 Actual Actual Actual Forecast Forecast Forecast Demand Demand Demand Week 1 52 57 63 55 66 77 Week 2 49 58 68 69 75 65 Week 3 47 50 58 65 80 74 Week 4 60 53 58 55 78 67 57 Week 5 49 57 64 76 77...
1. Forecast demand for Year 4.
a. Explain what technique you utilized to forecast your
demand.
b. Explain why you chose this technique over others.
Year 3 Year 1 Year 2 Actual Actual Actual Forecast Forecast Forecast Demand Demand Demand Week 1 52 57 63 55 66 77 Week 2 49 58 68 69 75 65 Week 3 47 50 58 65 80 74 Week 4 60 53 58 55 78 67 57 Week 5 49 57 64 76 77...
 Please compute your z -don't use a package State your conclusion in plain English - not just rejection 1 Students in the online class are suspicious that their schools 60 point loss may have caused their teacher to take out his frustration on the students by giving them a harder than usual exam. They manage to hack into his computer and get the following data: Scores for test Nov 2011 71 74 64 77 58 72 73 79 50 78...
 The given data is the grades for people in this class. The goal here is to determine the factors that effect student's Grade in the class. 4) Find the mean and median for the men's and the women's Quizzes. Gender Men Women 5) Test the claim that the majority of students at this class are women. F M F F M F F F F M M F F F M F F F F M M F F M...
Most questions answered within 3 hours.
-
D. A student completed 20 courses in the School of Arts and
Sciences. Her grades in...
asked 1 hour ago -
teo
pucks moving on a frictionless air table are about to collide. the
1.5 kg puck...
asked 1 hour ago -
Problem #1
The area between Z = 0 and Z = 2.50
The area between Z...
asked 2 hours ago -
1. What is the meaning of the term communication style?
2. What are the benefits to...
asked 2 hours ago -
9.) You are buying a car that cost $26,500. You make payments of
$412 each month...
asked 2 hours ago -
. Suppose a discrete random variable has probability
distribution
P(x) = .2 if x = 0...
asked 3 hours ago -
Under the influence of its drive force, a snowmobile is moving
at a constant velocity along...
asked 4 hours ago -
Why do organizations decline? What steps can top
management take to halt, decline, and restore organizational...
asked 4 hours ago -
What mechanisms Drive speciation??
(I.e. what was Dawins theory on the orgin of species, and how...
asked 5 hours ago -
The manager at a car assembly plant believes that the mean
assembly time for a car...
asked 6 hours ago -
Which of the following is true of electron capture?
A) It decreases the nuclide's mass number...
asked 8 hours ago -
Assuming an efficiency of 43.10%, calculate the actual yield of
magnesium nitrate formed from 114.9 g...
asked 8 hours ago