
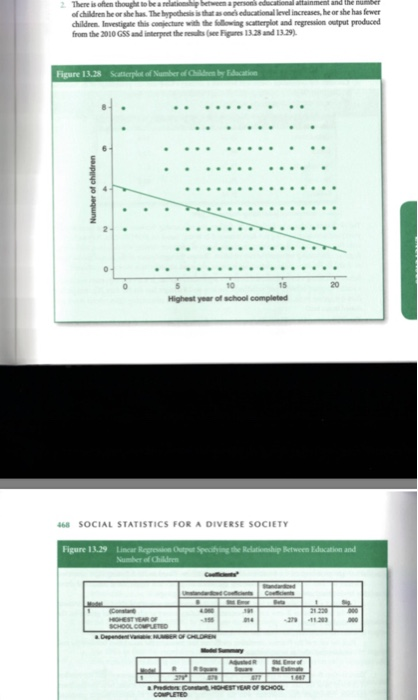
o children he or she has. The bypochesis is that as on educational level increases,he or she has fewer children Investigate this conjectune with the ollowing sctterplot and negression output prodaced from the 2010 GSS and interpenet the nesls (ee Figs 13.28 and 13.29) Figure 13,28 Scatterplt of Number of 15 20 10 Highest year of school completed 468 SOCIAL STATISTICS FOR A DIVERSE SOCIETY Figure 13.29 Lincar Rsn Oitpus Specitying the Relationship Between Education and
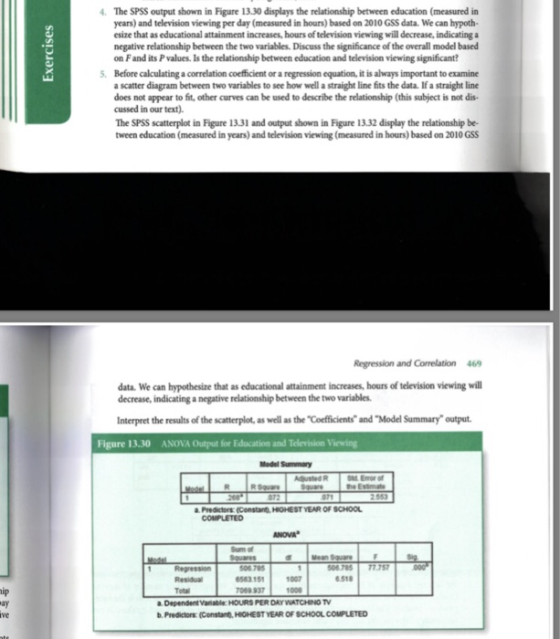
The SPSS output shown in Figure 13.30 displays the relationship between education (measured in years) and television viewing per day (measured in hours) based on 2010 GSS data. We can hypoth- esize that as educational attainment increases, hours of television viewing will decrease, indicating a negative relationship between the two variables. Discuss the significance of the overall model based on Fand its P values. Is the relationship between education and television viewing significant? Before calculating a correlation coefficient or a regression equation, it is always important to examine a scatter diagram between two variables to see how well a straight line fits the data. If a straight line does not appear to fit, other curves can be used to describe the relationship (this subject is not dis- cussed in our text). The SPSS scatterplot in Figure 13.31 and output shown in Figure 13.32 display the relationship be- tween education (measured in years) and television viewing (measured in hours) based on 2010 GSS 5. Regression and Correlation 469 data. We can hypothesize that as educational attainment increases, hours of television viewing will decrease, indicating a negative relationship between the two variables Interpret the results of the scatterplot, as well as the "Coefficients and "Model Summary output. Figure 13.30 ANOVA Output for Education and Television Viewing Model Summary he Estmate a Predictors (Constan HIOHEST YEAR OF SCHOOL NOVA Mean Square 06 785 563 1511007 069 937100 1506 78577757 00G 6518 Total ip ay Ive a Dependent Variable: HOURS PER DAYWATCHINO TV b.Predictors: (Constant. HIGHEST YEAR OF SCHOOL COMPLETED
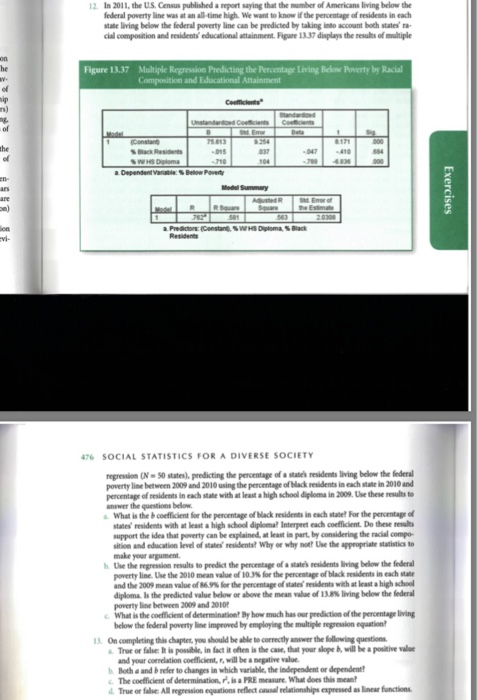
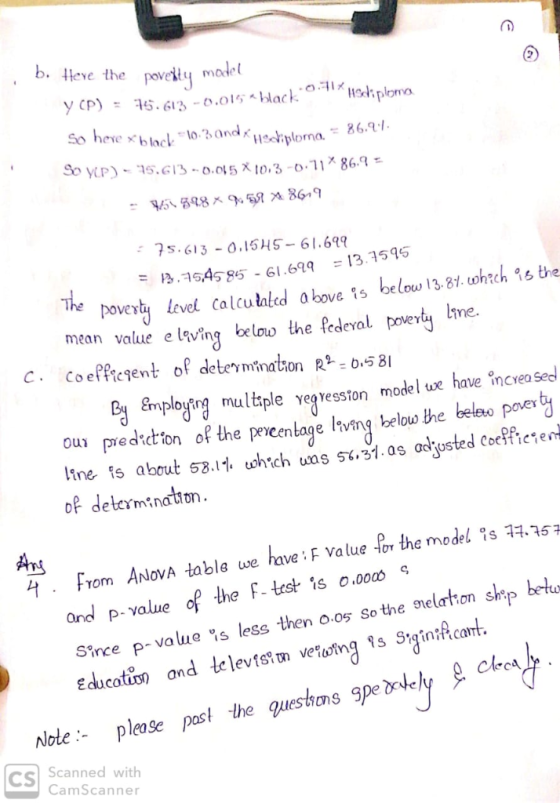
2 In 2011, the U.S. Census published a report saying that the mumber of Americans living below the federal poverty line was at an all time high We want to know if the pencentage of residents in each tate living below the federal poverty line can be predicted by taking into account both states composition and residents' educational attainment. Fpre 1337 daglays the results of㎖iple Figure 13.37 Multiple Regression Predicting the Percentage Living Below Poverty by Racial Black Resin 76 SOCIAL STATISTICS FOR A DIVERSE SOCIETY regression (N- 50 states) predicting the percentage of a states residents living below the federal poverty line between 2009 and 2010 using the percentage of black residents in each state in 2010 and percentage of nesidents in each state with at least a high school diploma in 2009 Use these resultst answer the questions below What is the & coefficient for the percentage of black residents in each state! For the percentage of states residents with at least a high school dipioma? Interpeet each coefficient. Do these ress support the idea that poverty can be explained, at least in part, by considering the racial compo- sition and education level of states residents? Why or why nott Use the appropriate statistics to make your argument Use the regression results to predict the pencentage of a state's residents living below the federal poverty lineUne the 2010 mean value of 103% for the percent ofMek residents in each state and the 2009 mean value of 8.9%for percentage of states' residents with at least a highschool diploma Is the predicted value below or above the mean vale of 13.8iinglow the federal poverty line betweem 2009 and 3010 C What is the coefficient of determmination by how much has our prediction of the percentage living below the federal poverty line improved by employing the multiple regression eqaation On completing this chapter you should be able to correctly answer the following questions Troe or false It is possible, in fact it often is the case, that your slope b will be a posiltive v and your correlation coefficient, , will be a negative value. h Both a and b refer to changes in which variable, the independent or dependent c The coefficient of determination,F, is a PRE measure. What does this mean True or fae All negression equations reflect caual relationships expressed as linear functions
Homework Answers

Add Answer to:
Country Austria 27.8 22.3 44.8 6.8 1.6 10.7 7.4 22.8 35.5 27.2 30.1 50.1 29.0 50.3 35.9 33.8 Neth...
A. What is the b (slope) for education? (-0.220 / 0.066 / -0.255 / 0.043) B. Is...
 A. What is the b (slope) for education? (-0.220 / 0.066 / -0.255
/ 0.043)
B. Is there a positive or negative relationship
between education and television viewing hours? (Negative /
Positive)
C. What is the b (slope) for number of children?
(-0.220 / 0.066 / -0.255 / 0.043)
D. Is there a positive or negative relationship between number
of children and television viewing hours? (Negative / Positive)
E. What is the equation for multiple regression?
-a=mean of y-slope(mean of x)
-b=...
A. What is the b (slope) for education? (-0.220 / 0.066 / -0.255
/ 0.043)
B. Is there a positive or negative relationship
between education and television viewing hours? (Negative /
Positive)
C. What is the b (slope) for number of children?
(-0.220 / 0.066 / -0.255 / 0.043)
D. Is there a positive or negative relationship between number
of children and television viewing hours? (Negative / Positive)
E. What is the equation for multiple regression?
-a=mean of y-slope(mean of x)
-b=...
1. Many companies use a incoming shipments of parts, raw materials, and so on. In the...
 1. Many companies use a incoming shipments of parts, raw materials, and so on. In the electronics industry, component parts are commonly shipped from suppliers in large lots. Inspection of a sample of n components can be viewed as the n trials of a binomial experimem. The outcome for each component tested (trialD will be that the component is classified as good or defective defective components in the lot do not exceed 1 %. Suppose a random sample of fiver...
 A. What is the b (slope) for education? (-0.220 / 0.066 / -0.255
/ 0.043)
B. Is there a positive or negative relationship
between education and television viewing hours? (Negative /
Positive)
C. What is the b (slope) for number of children?
(-0.220 / 0.066 / -0.255 / 0.043)
D. Is there a positive or negative relationship between number
of children and television viewing hours? (Negative / Positive)
E. What is the equation for multiple regression?
-a=mean of y-slope(mean of x)
-b=...
A. What is the b (slope) for education? (-0.220 / 0.066 / -0.255
/ 0.043)
B. Is there a positive or negative relationship
between education and television viewing hours? (Negative /
Positive)
C. What is the b (slope) for number of children?
(-0.220 / 0.066 / -0.255 / 0.043)
D. Is there a positive or negative relationship between number
of children and television viewing hours? (Negative / Positive)
E. What is the equation for multiple regression?
-a=mean of y-slope(mean of x)
-b=...
 1. Many companies use a incoming shipments of parts, raw materials, and so on. In the electronics industry, component parts are commonly shipped from suppliers in large lots. Inspection of a sample of n components can be viewed as the n trials of a binomial experimem. The outcome for each component tested (trialD will be that the component is classified as good or defective defective components in the lot do not exceed 1 %. Suppose a random sample of fiver...
Most questions answered within 3 hours.
-
A hospital performs 100 surgeries per week. The probability that
complications after surgery occur is 10%....
asked 38 seconds ago -
A 5.20 mW helium neon laser emits a visible laser beam with a
wavelength of 633...
asked 1 minute ago -
In preparing its cash flow statement for the year ended December
31, 2018, Green Co. gathered...
asked 2 minutes ago -
Donna is 18 years old and full time accounting student.She is
saving for an overseas holiday...
asked 2 minutes ago -
Service-oriented architectures (SOA) provide
object-oriented architectures for web platforms that represent a
collection of services. SOA...
asked 3 minutes ago -
Le Terroir Winery is considering an expansion project to produce
fine wines. The trial expansion will...
asked 12 minutes ago -
The Bahraini public budget experiences deficit in the last
seven years, what are procedures are taken...
asked 19 minutes ago -
You invested $30,000 in a mutual fund at the beginning of the
year when the NAV...
asked 23 minutes ago -
Would you expect the price elasticity of supply for guitars to
be more inelastic in the...
asked 24 minutes ago -
A snowmobile is originally at the point with position vector
30.1 m at 95.0° counterclockwise from...
asked 24 minutes ago -
MAN3240 Organizational Behavior
In one to two paragraphs
6.) How can understanding emotions make me more...
asked 32 minutes ago -
Identify one individual who, in your opinion, is an excellent
leader. List the qualities that this...
asked 30 minutes ago