The accompanying data are the number of wins and the earned run averages (mean number of earned runs allowed per nine innings pitched) for eight baseball pitchers in a recent season. Find the equati...
The accompanying data are the number of wins and the earned run averages (mean number of earned runs allowed per nine innings pitched) for
eight
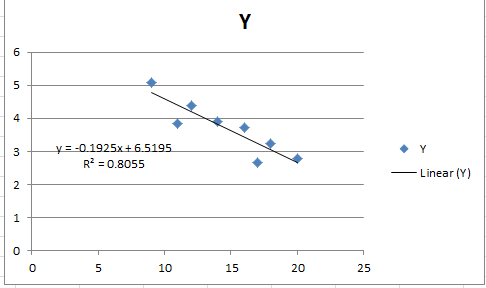
baseball pitchers in a recent season. Find the equation of the regression line. Then construct a scatter plot of the data and draw the regression line. Then use the regression equation to predict the value of y for each of the given x-values, if meaningful. If the x-value is not meaningful to predict the value of y, explain why not.
a) x=5 wins
b) x=10wins
c) x=21wins
d) x=15 wins
the equation of the regression line is y=___x+_____
round to two decimal places if necessary
construct a scatter plot of the data and draw the regression line.
(a) Predict the ERA for
five
wins, if it is meaningful. Select the correct choice below and, if necessary, fill in the answer box within your choice.
A) y=___ round to 2 decimal places as needed
B) it is not meaningful to predict this value of y because x=5 is not an x-value in the original data
C. it is not meaningful to predict this value of y because x=5 is well outside the range of the original data
(b) Predict the ERA for
10
wins, if it is meaningful. Select the correct choice below and, if necessary, fill in the answer box within your choice.
A) y=___ round to 2 decimal places if needed
B) it is not meaningful... same option as above for be only with 10 instead
C) it is not meaningful... same option as for c above except it says x=10
(c) Predict the ERA for
twenty one
wins, if it is meaningful. Select the correct choice below and, if necessary, fill in the answer box within your choice.
same options as above for a b and c except wit the 21
(d) Predict the ERA for
fifteen
wins, if it is meaningful. Select the correct choice below and, if necessary, fill in the answer box within your choice.
.18
Homework Answers
I HOPE ITS HELPFUL TO YOU IF YOU HAVE ANY DOUBTS PLS COMMENTS BELOW..I WILL BE THERE TO HELP YOU...ALL THE BEST...
ANSWER:
Here i am taking this values
"Wins, x","Earned run average, y"
20,2.78
18,3.23
17,2.67
16,3.73
14,3.89
12,4.39
11,3.85
9,5.09
Here is the grafh

a) When x = 5

b) When x = 10

c) When x = 21

d) When x =15

HOPE YOU UNDERSTAND...
PLS RATE THUMBS UP....ITS HELPS ME ALOT...
THANK YOU...!!
Add Answer to:
The accompanying data are the number of wins and the earned run averages (mean number of earned runs allowed per nine innings pitched) for eight baseball pitchers in a recent season. Find the equati...
> The accompanying data are the number of wins and the earned run averages (mean number...
 > The accompanying data are the number of wins and the earned run averages (mean number of earned runs allowed per nine innings pitched) for eight baseball pitchers in a recent season. Find the equation of the regression line. Then construct a scatter plot of the data and draw the regression line. Then use the regression equation to predict the value of y for each of the given x-values, if meaningful. If the x-value is not meaningful to predict the...
The accompanying data are the coloris contents and the sugar content in grof 11 high fiber...
 The accompanying data are the coloris contents and the sugar content in grof 11 high fiber breatest cereals. Find the equation of the regression in Then construida soate plot of the data and draw the regression fine. Then the region equation to predict the value of y for each of the given as it meaning the value is not meaningful to predict the value of y, explain why not 150 198 Click the icon to view the table of caloric...
This is one question divided in A B4cC and D. Thank you | 10 of 10...
 This is one question divided in A B4cC and D. Thank
you
| 10 of 10 (6 complete) ▼ i Lengths and Girths Length, xGirth, y 137 168 153 146 159 159 123 136 154 148 148 147 105 129 116 106 125 118 104 103 121 109 107 108 iz. Criapicr 10 of 10(6 The accompanying data are the length (in centimeters) and girths (in centimeters) of 12 harbor seals Find the equation of the regression line. Then construct...
This is one question divided in A B4cC and D. Thank
you
| 10 of 10 (6 complete) ▼ i Lengths and Girths Length, xGirth, y 137 168 153 146 159 159 123 136 154 148 148 147 105 129 116 106 125 118 104 103 121 109 107 108 iz. Criapicr 10 of 10(6 The accompanying data are the length (in centimeters) and girths (in centimeters) of 12 harbor seals Find the equation of the regression line. Then construct...
Find the equation of the regression line for the given data. Then construct a scatter plot...
 Find the equation of the regression line for the given data. Then construct a scatter plot of the data and draw the regression line. (The pair of variables have a significa correlation.) Then use the regression equation to predict the value of y for each of the given x-values, if meaningful. The table below shows the heights (in feet) and the number of stories of six notable buildings in a city. Height, x 758 621 518 510 492 483 (a)...
519 Find the equation of the regression line for the given data. Then construct a scatter...
 519 Find the equation of the regression line for the given data. Then construct a scatter plot of the data and draw the regression line. (The pair of variables have a significant correlation.) Then use the regression equation to predict the value of y for each of the given x-values, if meaningful The table below shows the heights (in feet) and the number of stories of six notable buildings in a city Height, 778 621 510 494 473 (a) x...
Find the equation of the regression line for the given data. Then construct a scatter plot...
 Find the equation of the regression line for the given data. Then construct a scatter plot of the data and draw the regression line. (The pair of variables has a significant correlation.) Then use the regressiorn equation to predict the value of y for each of the given x-values, if meaningful. The table shows the shoe size and heights (in) for 6 men Shoe size: x-T8.5 110T15|130|135 (a) x=size 10 0 (b)x-size 10.5 3.5 745 725(c)x-s size 16.0 (d)x- size...
Find the equation of the regression line for the given data. Then construct a scatter plot...
 Find the equation of the regression line for the given data. Then construct a scatter plot of the data and draw the regression line. (The pair of variables have a significant correlation.) Then use the regression equation to predict the value of y for each of the given x-values, if meaningful. The number of hours 6 students spent for a test and their scores on that test are shown below. Hours spent studying, X 2 5 5 (a) x =...
0 Find the equation of the regression line for the given data. The construct a scatter...
 0 Find the equation of the regression line for the given data. The construct a scatter plot of the date and draw the regression in (The pair of we have a significant corelation) Then use the regression equation to predict the value ofy for each of the given x-vous meaningful. The table below shows the heights on tool and the number of stories of si notable buildings in a city Helght, 775 510 500 (0) 500 fot b)x500 Stories 37...
Find the equation of the regression line for the given data. Then construet a scatter plot...
 Find the equation of the regression line for the given data. Then construet a scatter plot of the data and draw the regression line. (Each pair of variables has a significant corrlaton.) Then use the regression equation to predict the value of y for each of the given x-valu meaningful. The caloric content and the sodium content (in milligrams) for 6 beef hot dogs are shown in the table below. 120 330 alories, x odium 160 430 190 520 (a)...
Find the equation of the regression line for the given data. Then construct a scatter plot...
 Find the equation of the regression line for the given data. Then construct a scatter plot of the data and draw the regression line. (The pair of variables have a significant correlation.) Then use the regression equation to predict the value of y for each of the given x-values, if meaningful. The table below shows the heights (in feet) and the number of stories of six notable buildings in a city Height, x 768 628 518 511 491 478 (a)...
 > The accompanying data are the number of wins and the earned run averages (mean number of earned runs allowed per nine innings pitched) for eight baseball pitchers in a recent season. Find the equation of the regression line. Then construct a scatter plot of the data and draw the regression line. Then use the regression equation to predict the value of y for each of the given x-values, if meaningful. If the x-value is not meaningful to predict the...
 The accompanying data are the coloris contents and the sugar content in grof 11 high fiber breatest cereals. Find the equation of the regression in Then construida soate plot of the data and draw the regression fine. Then the region equation to predict the value of y for each of the given as it meaning the value is not meaningful to predict the value of y, explain why not 150 198 Click the icon to view the table of caloric...
 This is one question divided in A B4cC and D. Thank
you
| 10 of 10 (6 complete) ▼ i Lengths and Girths Length, xGirth, y 137 168 153 146 159 159 123 136 154 148 148 147 105 129 116 106 125 118 104 103 121 109 107 108 iz. Criapicr 10 of 10(6 The accompanying data are the length (in centimeters) and girths (in centimeters) of 12 harbor seals Find the equation of the regression line. Then construct...
This is one question divided in A B4cC and D. Thank
you
| 10 of 10 (6 complete) ▼ i Lengths and Girths Length, xGirth, y 137 168 153 146 159 159 123 136 154 148 148 147 105 129 116 106 125 118 104 103 121 109 107 108 iz. Criapicr 10 of 10(6 The accompanying data are the length (in centimeters) and girths (in centimeters) of 12 harbor seals Find the equation of the regression line. Then construct...
 Find the equation of the regression line for the given data. Then construct a scatter plot of the data and draw the regression line. (The pair of variables have a significa correlation.) Then use the regression equation to predict the value of y for each of the given x-values, if meaningful. The table below shows the heights (in feet) and the number of stories of six notable buildings in a city. Height, x 758 621 518 510 492 483 (a)...
 519 Find the equation of the regression line for the given data. Then construct a scatter plot of the data and draw the regression line. (The pair of variables have a significant correlation.) Then use the regression equation to predict the value of y for each of the given x-values, if meaningful The table below shows the heights (in feet) and the number of stories of six notable buildings in a city Height, 778 621 510 494 473 (a) x...
 Find the equation of the regression line for the given data. Then construct a scatter plot of the data and draw the regression line. (The pair of variables has a significant correlation.) Then use the regressiorn equation to predict the value of y for each of the given x-values, if meaningful. The table shows the shoe size and heights (in) for 6 men Shoe size: x-T8.5 110T15|130|135 (a) x=size 10 0 (b)x-size 10.5 3.5 745 725(c)x-s size 16.0 (d)x- size...
 Find the equation of the regression line for the given data. Then construct a scatter plot of the data and draw the regression line. (The pair of variables have a significant correlation.) Then use the regression equation to predict the value of y for each of the given x-values, if meaningful. The number of hours 6 students spent for a test and their scores on that test are shown below. Hours spent studying, X 2 5 5 (a) x =...
 0 Find the equation of the regression line for the given data. The construct a scatter plot of the date and draw the regression in (The pair of we have a significant corelation) Then use the regression equation to predict the value ofy for each of the given x-vous meaningful. The table below shows the heights on tool and the number of stories of si notable buildings in a city Helght, 775 510 500 (0) 500 fot b)x500 Stories 37...
 Find the equation of the regression line for the given data. Then construet a scatter plot of the data and draw the regression line. (Each pair of variables has a significant corrlaton.) Then use the regression equation to predict the value of y for each of the given x-valu meaningful. The caloric content and the sodium content (in milligrams) for 6 beef hot dogs are shown in the table below. 120 330 alories, x odium 160 430 190 520 (a)...
 Find the equation of the regression line for the given data. Then construct a scatter plot of the data and draw the regression line. (The pair of variables have a significant correlation.) Then use the regression equation to predict the value of y for each of the given x-values, if meaningful. The table below shows the heights (in feet) and the number of stories of six notable buildings in a city Height, x 768 628 518 511 491 478 (a)...
Most questions answered within 3 hours.
-
An empty test tube weighs 15.923 grams. Then,
MgCl2•6H2O is added into the test tube. After...
asked 45 minutes ago -
Please answer true or false. Words
cannot be changed or added in to make it true...
asked 43 minutes ago -
(a) A piston at 6.1 atm contains a gas that occupies a volume of
3.5 L....
asked 44 minutes ago -
Assume memory access is 10 units of time and disk access is
10000 units of time....
asked 1 hour ago -
1. Are all good samples random?
2. Magazines often report surveys giving statistics such as “63%...
asked 1 hour ago -
Under all the various types of market structures, firms
must eventually earn some economic profits for...
asked 1 hour ago -
Consider the following fitness regime for a single locus trait
with two co-dominant alleles: w11 =...
asked 1 hour ago -
A large cable company reports the following.
80% of its customers subscribe to its cable TV...
asked 1 hour ago -
Please answer the question in brief.
Discuss the role of ERP in organizations. Are ERP tools...
asked 1 hour ago -
Discuss the pros and cons of collaborative software such
as SameTime. Does it increase productivity? What...
asked 1 hour ago -
Buying your in-laws a gift because it’s expected is
due to the ____________ motive of gift-giving....
asked 1 hour ago -
Calculate the expected value, the variance, and the standard
deviation of the given random variable X....
asked 2 hours ago