

Homework Answers


Add Answer to:
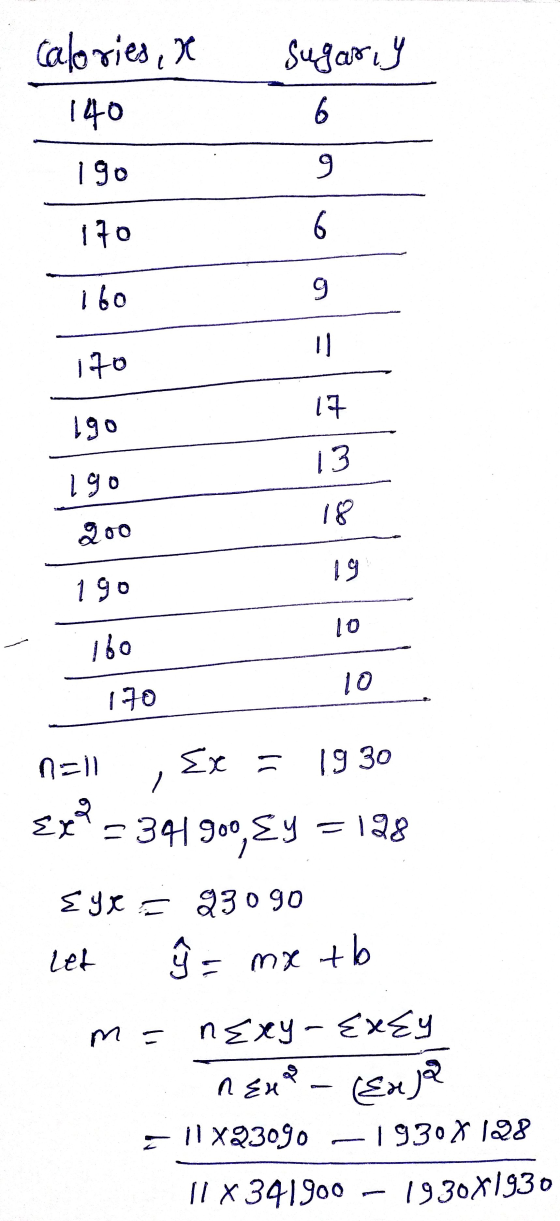
The accompanying data are the coloris contents and the sugar content in grof 11 high fiber...
> The accompanying data are the number of wins and the earned run averages (mean number...
 > The accompanying data are the number of wins and the earned run averages (mean number of earned runs allowed per nine innings pitched) for eight baseball pitchers in a recent season. Find the equation of the regression line. Then construct a scatter plot of the data and draw the regression line. Then use the regression equation to predict the value of y for each of the given x-values, if meaningful. If the x-value is not meaningful to predict the...
Find the equation of the regression line for the given data. Then construet a scatter plot...
 Find the equation of the regression line for the given data. Then construet a scatter plot of the data and draw the regression line. (Each pair of variables has a significant corrlaton.) Then use the regression equation to predict the value of y for each of the given x-valu meaningful. The caloric content and the sodium content (in milligrams) for 6 beef hot dogs are shown in the table below. 120 330 alories, x odium 160 430 190 520 (a)...
Find the equation of the regression line for the given data. Then construct a scatter plot of the data and draw the regression line. (Each pair of variables has a significant correlation.) Then use t...
 Find the equation of the regression line for the given data. Then construct a scatter plot of the data and draw the regression line. (Each pair of variables has a significant correlation.) Then use the regression equation to predict the value of y for each of the given x-values, if meaningful. The caloric content and the sodium content (in milligrams) for 6 beef hot dogs are shown in the table below. 120 340 120 370 (a) x 180 calories (c)...
can i get help answering these questions please i cant seem to undestand how to solve...
 can i get help answering these questions please i cant seem to
undestand how to solve
Find the equation of the regression line for the given data. The construct a scatter plot of the data and draw the regression in Each of the has a signifantomation) Then use the regression in to pred value ofy for each of the given to meaning. The color content and the sodium content in migrans) forte he dogs are shown in the late to...
can i get help answering these questions please i cant seem to
undestand how to solve
Find the equation of the regression line for the given data. The construct a scatter plot of the data and draw the regression in Each of the has a signifantomation) Then use the regression in to pred value ofy for each of the given to meaning. The color content and the sodium content in migrans) forte he dogs are shown in the late to...
The accompanying data are the number of wins and the earned run averages (mean number of earned runs allowed per nine innings pitched) for eight baseball pitchers in a recent season. Find the equati...
The accompanying data are the number of wins and the earned run averages (mean number of earned runs allowed per nine innings pitched) for eight baseball pitchers in a recent season. Find the equation of the regression line. Then construct a scatter plot of the data and draw the regression line. Then use the regression equation to predict the value of y for each of the given x-values, if meaningful. If the x-value is not meaningful to predict the value...
Find the equation of the regression line for the given data. Then construct a scatter plot...
 Find the equation of the regression line for the given data. Then construct a scatter plot of the data and draw the regression line (Each pair of variables has a significant correlation.) Then use the regression equation to predict the value of y for each of the given x-values, if meaningful. The caloric content and the sodium content (in milligrams) for 6 beef hot dogs are shown in the table below. Calories, x 150 170 130 120 90 180 (a)...
This is one question divided in A B4cC and D. Thank you | 10 of 10...
 This is one question divided in A B4cC and D. Thank
you
| 10 of 10 (6 complete) ▼ i Lengths and Girths Length, xGirth, y 137 168 153 146 159 159 123 136 154 148 148 147 105 129 116 106 125 118 104 103 121 109 107 108 iz. Criapicr 10 of 10(6 The accompanying data are the length (in centimeters) and girths (in centimeters) of 12 harbor seals Find the equation of the regression line. Then construct...
This is one question divided in A B4cC and D. Thank
you
| 10 of 10 (6 complete) ▼ i Lengths and Girths Length, xGirth, y 137 168 153 146 159 159 123 136 154 148 148 147 105 129 116 106 125 118 104 103 121 109 107 108 iz. Criapicr 10 of 10(6 The accompanying data are the length (in centimeters) and girths (in centimeters) of 12 harbor seals Find the equation of the regression line. Then construct...
Find the equation of the regression line for the given data. Then construct a scatter plot...
Find the equation of the regression line for the given data. Then construct a scatter plot of the data and draw the regression line. (Each pair of variables has a significant correlation.) Then use the regression equation to predict the value of y for each of the given x-values, if meaningful. The caloric content and the sodium content (in milligrams) for 6 beef hot dogs are shown in the table below. (a)x=180 (b)x=90 (c)x=120 (d)x=50 Calories, x Sodium, y 150 ...
0 Find the equation of the regression line for the given data. The construct a scatter...
 0 Find the equation of the regression line for the given data. The construct a scatter plot of the date and draw the regression in (The pair of we have a significant corelation) Then use the regression equation to predict the value ofy for each of the given x-vous meaningful. The table below shows the heights on tool and the number of stories of si notable buildings in a city Helght, 775 510 500 (0) 500 fot b)x500 Stories 37...
Fiber content (In grams per serving) and sugar content (in grams per serving) for 18 high...
 Fiber content (In grams per serving) and sugar content (in grams per serving) for 18 high fiber cereals are shown below. Fiber Content 7 11 11 7 9 7 12 12 9 13 11 9 12 7 14 7 99 Sugar Content 11 7 14 13 0 18 9 10 19 0 9 5 11 7 10 17 10 10 (a) Find the median, quartiles, and interquartile range for the fiber content data set. median lower quartile upper quartile interquartile...
 > The accompanying data are the number of wins and the earned run averages (mean number of earned runs allowed per nine innings pitched) for eight baseball pitchers in a recent season. Find the equation of the regression line. Then construct a scatter plot of the data and draw the regression line. Then use the regression equation to predict the value of y for each of the given x-values, if meaningful. If the x-value is not meaningful to predict the...
 Find the equation of the regression line for the given data. Then construet a scatter plot of the data and draw the regression line. (Each pair of variables has a significant corrlaton.) Then use the regression equation to predict the value of y for each of the given x-valu meaningful. The caloric content and the sodium content (in milligrams) for 6 beef hot dogs are shown in the table below. 120 330 alories, x odium 160 430 190 520 (a)...
 Find the equation of the regression line for the given data. Then construct a scatter plot of the data and draw the regression line. (Each pair of variables has a significant correlation.) Then use the regression equation to predict the value of y for each of the given x-values, if meaningful. The caloric content and the sodium content (in milligrams) for 6 beef hot dogs are shown in the table below. 120 340 120 370 (a) x 180 calories (c)...
 can i get help answering these questions please i cant seem to
undestand how to solve
Find the equation of the regression line for the given data. The construct a scatter plot of the data and draw the regression in Each of the has a signifantomation) Then use the regression in to pred value ofy for each of the given to meaning. The color content and the sodium content in migrans) forte he dogs are shown in the late to...
can i get help answering these questions please i cant seem to
undestand how to solve
Find the equation of the regression line for the given data. The construct a scatter plot of the data and draw the regression in Each of the has a signifantomation) Then use the regression in to pred value ofy for each of the given to meaning. The color content and the sodium content in migrans) forte he dogs are shown in the late to...
 Find the equation of the regression line for the given data. Then construct a scatter plot of the data and draw the regression line (Each pair of variables has a significant correlation.) Then use the regression equation to predict the value of y for each of the given x-values, if meaningful. The caloric content and the sodium content (in milligrams) for 6 beef hot dogs are shown in the table below. Calories, x 150 170 130 120 90 180 (a)...
 This is one question divided in A B4cC and D. Thank
you
| 10 of 10 (6 complete) ▼ i Lengths and Girths Length, xGirth, y 137 168 153 146 159 159 123 136 154 148 148 147 105 129 116 106 125 118 104 103 121 109 107 108 iz. Criapicr 10 of 10(6 The accompanying data are the length (in centimeters) and girths (in centimeters) of 12 harbor seals Find the equation of the regression line. Then construct...
This is one question divided in A B4cC and D. Thank
you
| 10 of 10 (6 complete) ▼ i Lengths and Girths Length, xGirth, y 137 168 153 146 159 159 123 136 154 148 148 147 105 129 116 106 125 118 104 103 121 109 107 108 iz. Criapicr 10 of 10(6 The accompanying data are the length (in centimeters) and girths (in centimeters) of 12 harbor seals Find the equation of the regression line. Then construct...
 0 Find the equation of the regression line for the given data. The construct a scatter plot of the date and draw the regression in (The pair of we have a significant corelation) Then use the regression equation to predict the value ofy for each of the given x-vous meaningful. The table below shows the heights on tool and the number of stories of si notable buildings in a city Helght, 775 510 500 (0) 500 fot b)x500 Stories 37...
 Fiber content (In grams per serving) and sugar content (in grams per serving) for 18 high fiber cereals are shown below. Fiber Content 7 11 11 7 9 7 12 12 9 13 11 9 12 7 14 7 99 Sugar Content 11 7 14 13 0 18 9 10 19 0 9 5 11 7 10 17 10 10 (a) Find the median, quartiles, and interquartile range for the fiber content data set. median lower quartile upper quartile interquartile...
Most questions answered within 3 hours.
-
Compile a list (7 or more) of other commands useful for
navigating or manipulating the UNIX/Linux...
asked 5 minutes ago -
How many grams of PbBr2 will precipitate when excess CrBr3
solution is added to 61.0 mL...
asked 7 minutes ago -
If I was given the address of 134.15.0.0/16 from my ISP and I
wanted to use...
asked 12 minutes ago -
What is the pH of the solution that results of dissolving 1.74g
of sodium hydroxide in...
asked 16 minutes ago -
Given a standardized normal distribution (with μ = 0 and a σ =
1), what is...
asked 54 minutes ago -
Given the following information:
acetic acid
CH3COOH
Ka = 1.8×10⁻⁵
triethylamine
(C2H5)3N
Kb = 5.2×10⁻⁴
(1)...
asked 40 minutes ago -
Potassium permanganate(KMNO4)is has a solubility of 6.4 g/ 100 g
of water at 20ºC, and 250...
asked 37 minutes ago -
51.
As the marginal propensity to expend rises, the multiplier:
decreases.
is impossible to determine.
increases....
asked 43 minutes ago -
The Baldwin Company currently has the following balances on their
balance sheet:
Total
Liabilities
$69,309
Common...
asked 46 minutes ago -
A quiet town in Kansas has 10 people, all of whom have the same
preferences. There...
asked 51 minutes ago -
Summarize what an organization needs from a leader.
a. Analyze what might happen to an organization...
asked 54 minutes ago -
How would one critically evaluate an organizations marketing
strategies from the viewpoint of its consumers, as...
asked 53 minutes ago