


Homework Answers
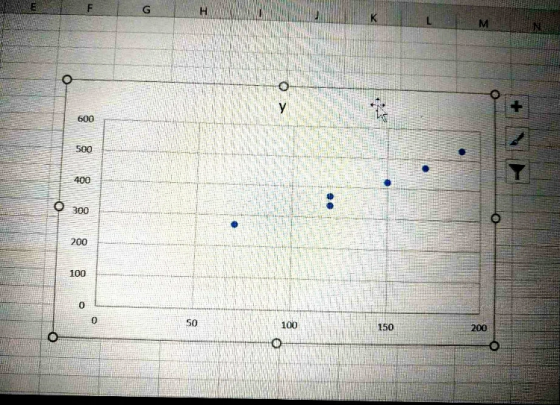
The graph is drawn in excel by first selecting the data then
insert then recommended charts then scatter diagram, and then we
have to set the limits of x and y axis accordingly. Here i have set
the limit of y to be maximum 500 and x limit to be maximum 200 as
the graph given in the options are having this limit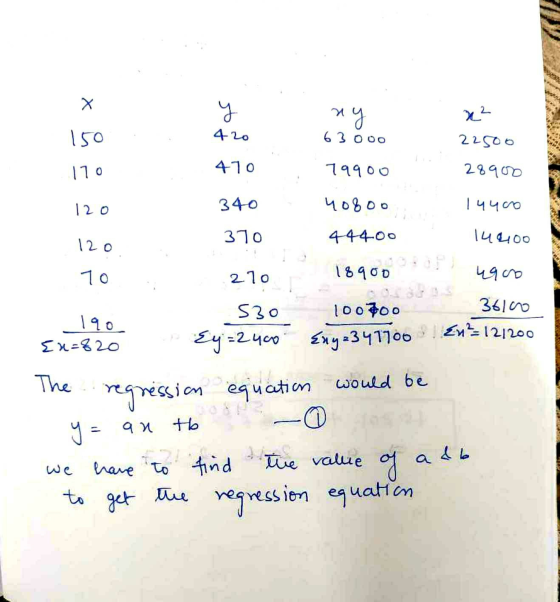


Add Answer to:
can i get help answering these questions please i cant seem to
undestand how to solve...
Test a claim that the mean amount of carbon monoxide in the air in U.S. cities...
 Test a claim that the mean amount of carbon monoxide in the air in U.S. cities is less than 231 parts per million. It was found that the mean amount of carbon monoxide in the air for the random sample of cities is 2.30 parts per million and the standard deviation is 2.11 parts per millon. At 0.05, can the claims be supported? Corriere parts a) through (e) below. Assume the population is normally distributed (a) loentity the claim and...
The accompanying data are the coloris contents and the sugar content in grof 11 high fiber...
 The accompanying data are the coloris contents and the sugar content in grof 11 high fiber breatest cereals. Find the equation of the regression in Then construida soate plot of the data and draw the regression fine. Then the region equation to predict the value of y for each of the given as it meaning the value is not meaningful to predict the value of y, explain why not 150 198 Click the icon to view the table of caloric...
, Test a claim that the mean amount of carbon monoxide in the air in U.S....
 , Test a claim that the mean amount of carbon monoxide in the air in U.S. cities is less than 2.31 parts per million. It was found that the me amount of carbon monoxide in the air for the random sample of 86 cities is 2.38 parts per million and the standard deviation is 2.12 parts million. At α= 0.10, can the claim be supported? Complete parts (a) through (e) below. Assume the population is normally distributed (a) Identify the...
Find the equation of the regression line for the given data. Then construet a scatter plot...
 Find the equation of the regression line for the given data. Then construet a scatter plot of the data and draw the regression line. (Each pair of variables has a significant corrlaton.) Then use the regression equation to predict the value of y for each of the given x-valu meaningful. The caloric content and the sodium content (in milligrams) for 6 beef hot dogs are shown in the table below. 120 330 alories, x odium 160 430 190 520 (a)...
can i get help answering both these questions please i am stuck. Construct a 95% confidence...
 can i get help answering both these questions please i am
stuck.
Construct a 95% confidence interval for Hy with the sample statistics for mean cholesterol content of a hamburger from two fast food chains and confidence interval construction formula below. Assume the populations are approximately normal with unequal variances Stats X = 68 mg, s, = 3.72 mg, n = 14 x = 53 mg, s, -2.13 mg, n, 16 - + ng ni my Confidence interval when (*-*)-4,...
can i get help answering both these questions please i am
stuck.
Construct a 95% confidence interval for Hy with the sample statistics for mean cholesterol content of a hamburger from two fast food chains and confidence interval construction formula below. Assume the populations are approximately normal with unequal variances Stats X = 68 mg, s, = 3.72 mg, n = 14 x = 53 mg, s, -2.13 mg, n, 16 - + ng ni my Confidence interval when (*-*)-4,...
Find the equation of the regression line for the given data. Then construct a scatter plot...
 Find the equation of the regression line for the given data. Then construct a scatter plot of the data and draw the regression line. (The pair of variaties have a significant correlation) Then use the regression equation to predict the value of yo each of the given x-values, if meaningful. The table below shows the height in feet) and the number of stories of six notable buildings in a city Heights 772 5110 503 483 Stories 51 (a)x= 501 foot...
0 Find the equation of the regression line for the given data. The construct a scatter...
 0 Find the equation of the regression line for the given data. The construct a scatter plot of the date and draw the regression in (The pair of we have a significant corelation) Then use the regression equation to predict the value ofy for each of the given x-vous meaningful. The table below shows the heights on tool and the number of stories of si notable buildings in a city Helght, 775 510 500 (0) 500 fot b)x500 Stories 37...
Testa claim that the mean amount of carbon monoxide in the ar in U.S.es is less...
 Testa claim that the mean amount of carbon monoxide in the ar in U.S.es is less than 232 parts per million. It was found that the mean amount of carbon monoxide in the air for the random sample of 64 cities is 2.38 ans per million and the standard deviation to 2.11 para permition. Aaro.01.con the cambe sucoomed? Completo para a rough e bew. Assume that is needed (a) terly clamand, and H. Which of the following comedy Hd, Ho...
(b) Use technology to find the critical value(s) and identify the rejection region(s). (c) Find the...
 (b) Use technology to find the critical value(s) and identify
the rejection region(s).
(c) Find the standardized test statistic, t.
(d) Decide whether to reject or fail to reject the null
hypothesis.
(e) Interpret the decision in the context of the original
claim.
7.3.23-T Question Help Test a claim that the mean amount of carbon monoxide in the air in U.S. cities is less than 2.33 parts per million. It was found that the mean amount of cartxon monoxide in...
(b) Use technology to find the critical value(s) and identify
the rejection region(s).
(c) Find the standardized test statistic, t.
(d) Decide whether to reject or fail to reject the null
hypothesis.
(e) Interpret the decision in the context of the original
claim.
7.3.23-T Question Help Test a claim that the mean amount of carbon monoxide in the air in U.S. cities is less than 2.33 parts per million. It was found that the mean amount of cartxon monoxide in...
Find the equation of the regression line for the given data. Then construct a scater plot...
 Find the equation of the regression line for the given data. Then construct a scater plot of the data and draw the regression line (The pair of variubles have a significant comelation) Then use the regression equation to predict the vakue of y for each of the given x-values, if meaningul The table below shows the heights (in feet) and the number of shories of six notable buildings in a city 758 Height, K Stories, y 621 47 (a)490 feet...
 Test a claim that the mean amount of carbon monoxide in the air in U.S. cities is less than 231 parts per million. It was found that the mean amount of carbon monoxide in the air for the random sample of cities is 2.30 parts per million and the standard deviation is 2.11 parts per millon. At 0.05, can the claims be supported? Corriere parts a) through (e) below. Assume the population is normally distributed (a) loentity the claim and...
 The accompanying data are the coloris contents and the sugar content in grof 11 high fiber breatest cereals. Find the equation of the regression in Then construida soate plot of the data and draw the regression fine. Then the region equation to predict the value of y for each of the given as it meaning the value is not meaningful to predict the value of y, explain why not 150 198 Click the icon to view the table of caloric...
 , Test a claim that the mean amount of carbon monoxide in the air in U.S. cities is less than 2.31 parts per million. It was found that the me amount of carbon monoxide in the air for the random sample of 86 cities is 2.38 parts per million and the standard deviation is 2.12 parts million. At α= 0.10, can the claim be supported? Complete parts (a) through (e) below. Assume the population is normally distributed (a) Identify the...
 Find the equation of the regression line for the given data. Then construet a scatter plot of the data and draw the regression line. (Each pair of variables has a significant corrlaton.) Then use the regression equation to predict the value of y for each of the given x-valu meaningful. The caloric content and the sodium content (in milligrams) for 6 beef hot dogs are shown in the table below. 120 330 alories, x odium 160 430 190 520 (a)...
 can i get help answering both these questions please i am
stuck.
Construct a 95% confidence interval for Hy with the sample statistics for mean cholesterol content of a hamburger from two fast food chains and confidence interval construction formula below. Assume the populations are approximately normal with unequal variances Stats X = 68 mg, s, = 3.72 mg, n = 14 x = 53 mg, s, -2.13 mg, n, 16 - + ng ni my Confidence interval when (*-*)-4,...
can i get help answering both these questions please i am
stuck.
Construct a 95% confidence interval for Hy with the sample statistics for mean cholesterol content of a hamburger from two fast food chains and confidence interval construction formula below. Assume the populations are approximately normal with unequal variances Stats X = 68 mg, s, = 3.72 mg, n = 14 x = 53 mg, s, -2.13 mg, n, 16 - + ng ni my Confidence interval when (*-*)-4,...
 Find the equation of the regression line for the given data. Then construct a scatter plot of the data and draw the regression line. (The pair of variaties have a significant correlation) Then use the regression equation to predict the value of yo each of the given x-values, if meaningful. The table below shows the height in feet) and the number of stories of six notable buildings in a city Heights 772 5110 503 483 Stories 51 (a)x= 501 foot...
 0 Find the equation of the regression line for the given data. The construct a scatter plot of the date and draw the regression in (The pair of we have a significant corelation) Then use the regression equation to predict the value ofy for each of the given x-vous meaningful. The table below shows the heights on tool and the number of stories of si notable buildings in a city Helght, 775 510 500 (0) 500 fot b)x500 Stories 37...
 Testa claim that the mean amount of carbon monoxide in the ar in U.S.es is less than 232 parts per million. It was found that the mean amount of carbon monoxide in the air for the random sample of 64 cities is 2.38 ans per million and the standard deviation to 2.11 para permition. Aaro.01.con the cambe sucoomed? Completo para a rough e bew. Assume that is needed (a) terly clamand, and H. Which of the following comedy Hd, Ho...
 (b) Use technology to find the critical value(s) and identify
the rejection region(s).
(c) Find the standardized test statistic, t.
(d) Decide whether to reject or fail to reject the null
hypothesis.
(e) Interpret the decision in the context of the original
claim.
7.3.23-T Question Help Test a claim that the mean amount of carbon monoxide in the air in U.S. cities is less than 2.33 parts per million. It was found that the mean amount of cartxon monoxide in...
(b) Use technology to find the critical value(s) and identify
the rejection region(s).
(c) Find the standardized test statistic, t.
(d) Decide whether to reject or fail to reject the null
hypothesis.
(e) Interpret the decision in the context of the original
claim.
7.3.23-T Question Help Test a claim that the mean amount of carbon monoxide in the air in U.S. cities is less than 2.33 parts per million. It was found that the mean amount of cartxon monoxide in...
 Find the equation of the regression line for the given data. Then construct a scater plot of the data and draw the regression line (The pair of variubles have a significant comelation) Then use the regression equation to predict the vakue of y for each of the given x-values, if meaningul The table below shows the heights (in feet) and the number of shories of six notable buildings in a city 758 Height, K Stories, y 621 47 (a)490 feet...
Most questions answered within 3 hours.
-
The fuel economy of a 2011 Lexus RX 350 2wd 6 cylinder 3.5 L
automatic 5...
asked 57 seconds from now -
i.
the synthesized compund 2-bromo-butanal i have a IR peak at about
3200 and one at...
asked 59 seconds from now -
A
752 mL sample of water was placed in a 1000 gram pan of aluminum.
The...
asked 10 minutes ago -
1.In the context of chelation, what does binding strength mean?
What happens at the molecular level...
asked 3 minutes ago -
Describe two obstacles that makes fixing atmospheric nitrogen
difficult.
asked 22 minutes ago -
Evelyn incorporates her sole proprietorship, transferring it to
newly formed Papaya Corporation. The assets transferred have...
asked 8 minutes ago -
Assume that in a hydrogen atom, the electron circles the nucleus
in a circle of radius...
asked 17 minutes ago -
1 point) Given the significance level α=0.01 find the following:
(a) left-tailed z value z= (b)...
asked 11 minutes ago -
Calculate the expected value, the variance, and the standard
deviation of the given random variable X....
asked 13 minutes ago -
T
F 53) Most differences
between human groups are the result of biology rather than
culture....
asked 26 minutes ago -
A 5.20 mW helium neon laser emits a visible laser beam with a
wavelength of 633...
asked 29 minutes ago -
Assignment:
Your
organization has made a strategic decision
to
outsourcework
currently performed in house. You have...
asked 28 minutes ago