


Homework Answers
Answer #1
A)
The Ti-83 graphing calculator steps are as follows.
Press ON key, Press STAT key enter 1 and enter the data as shown below,
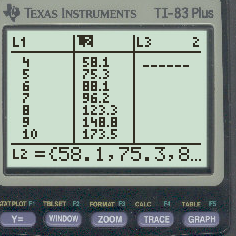
Press STAT, go to CALC and enter 5 the result is obtained as,

b) To find x=12, follow the below steps, click on Y= button and enter the equation as shown below,

set the window as shown below,

Click on Trace, the graph obtained as,

click 12 and press enter as shown below,

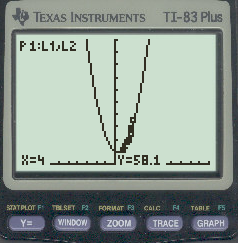
c) click on 2nd + Y= button, 1 and click on ON, press Graph, the scatter plot and function is as shown below,
Know the answer?
Add Answer to:
10:34 LTE < Back Name 1. The table shows a country's gross domestic expenditures on research and development (in billions of U.S. dollars). Let4 correspond to the year 2004 car R&D s...
Not the answer you're looking for?
Ask your own homework help question.
Our experts will answer your question WITHIN MINUTES for Free.
Similar Homework Help Questions
ADVERTISEMENT
Need Online Homework Help?
Ask
a QuestionGet Answers For Free
Most questions answered within 3 hours.
Most questions answered within 3 hours.
ADVERTISEMENT
ADVERTISEMENT
Active Questions
-
A 2180-kg car is slowed down uniformly from 24.6 m/s to 5.2 m/s
in 3.32 s....
asked 4 minutes ago -
Jesse’s Machining is looking to buy a new machine to handle a
new four-year contract for...
asked 10 minutes ago -
5. A slide mount of a fungal specimen is prepared. A slide and
coverslip are flame-sterilized....
asked 12 minutes ago -
A parallel plate capacitor has a charge Q, plates of area A and
separation d, where...
asked 14 minutes ago -
This question goes along with my test results for a psychology
seminar. The results were the...
asked 15 minutes ago -
A calorimeter contains 35.0 mL of water at 13.0 ∘C . When 1.40 g
of X...
asked 20 minutes ago -
[The following information applies to the questions
displayed below.]
Arndt, Inc. reported the following for 2021...
asked 21 minutes ago -
Equivalent Units of Conversion Costs
The Rolling Department of Kraus Steel Company had 2,370 tons in...
asked 27 minutes ago -
Genetic differences between closely related species are due to
changes at both synonymous and nonsynonymous sites...
asked 33 minutes ago -
Assignment:
Implement an 8 bit register in VHDL/Verilog using Model Sim
software. Show two test cases...
asked 38 minutes ago -
Think about the published number of fatalities in the
September 11th disaster in New York. Why...
asked 35 minutes ago -
Suppose you are very allergic to peanuts or even grass, and you
go into anaphylactic shock....
asked 36 minutes ago
ADVERTISEMENT