Problem 12-09 Financing Deficit Garlington Technologies Inc.'s 2016 financial statements are shown below: Balance Sheet as of December 31, 2016 Cash $ 180,000 Accounts payable $ 360,000...
Problem 12-09
Financing Deficit
Garlington Technologies Inc.'s 2016 financial statements are shown below:
Balance Sheet as of December 31, 2016
| Cash | $ 180,000 | Accounts payable | $ 360,000 | |
| Receivables | 360,000 | Notes payable | 156,000 | |
| Inventories | 720,000 | Line of credit | 0 | |
| Total current assets | $1,260,000 | Accruals | 180,000 | |
| Fixed assets | 1,440,000 | Total current liabilities | $ 696,000 | |
| Common stock | 1,800,000 | |||
| Retained earnings | 204,000 | |||
| Total assets | $2,700,000 | Total liabilities and equity | $2,700,000 |
Income Statement for December 31, 2016
| Sales | $3,600,000 |
| Operating costs | 3,279,720 |
| EBIT | $ 320,280 |
| Interest | 18,280 |
| Pre-tax earnings | $ 302,000 |
| Taxes (40%) | 120,800 |
| Net income | 181,200 |
| Dividends | $ 108,000 |
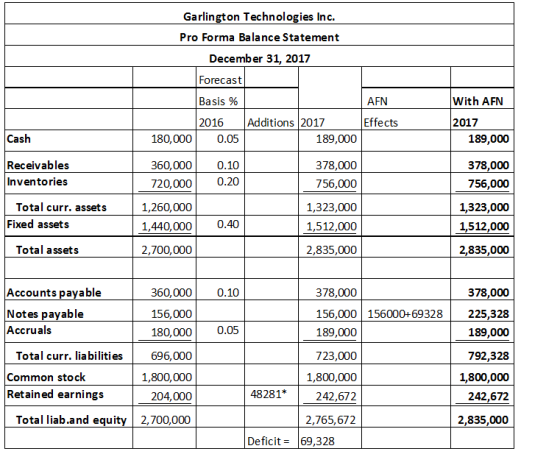
Suppose that in 2017 sales increase by 5% over 2016 sales and that 2017 dividends will increase to $150,000. Forecast the financial statements using the forecasted financial statement method. Assume the firm operated at full capacity in 2016. Use an interest rate of 14%, and assume that any new debt will be added at the end of the year (so forecast the interest expense based on the debt balance at the beginning of the year). Cash does not earn any interest income. Assume that the all new-debt will be in the form of a line of credit. Round your answers to the nearest dollar. Do not round intermediate calculations.
| Garlington Technologies Inc. Pro Forma Income Statement December 31, 2017 |
|||
| Sales | $ | ||
| Operating costs | $ | ||
| EBIT | $ | ||
| Interest | $ | ||
| Pre-tax earnings | $ | ||
| Taxes (40%) | $ | ||
| Net income | $ | ||
| Dividends: | $ | ||
| Addition to RE: | $ | ||
| Garlington Technologies Inc. Pro Forma Balance Statement December 31, 2017 |
|||
| Cash | $ | ||
| Receivables | $ | ||
| Inventories | $ | ||
| Total current assets | $ | ||
| Fixed assets | $ | ||
| Total assets | $ | ||
| Accounts payable | $ | ||
| Notes payable | $ | ||
| Accruals | $ | ||
| Total current liabilities | $ | ||
| Common stock | $ | ||
| Retained earnings | $ | ||
| Total liabilities and equity | $ | ||
Homework Answers

Add Answer to:
Problem 12-09 Financing Deficit Garlington Technologies Inc.'s 2016 financial statements are shown below: Balance Sheet as of December 31, 2016 Cash $ 180,000 Accounts payable $ 360,000...
Problem 12-09 Financing Deficit Garlington Technologies Inc.'s 2016 financial statements are shown below: Balance Sheet as...
 Problem 12-09 Financing Deficit Garlington Technologies Inc.'s 2016 financial statements are shown below: Balance Sheet as of December 31, 2016 $360,000 156,000 180,000 Cash $ 180,000 Accounts payable Receivables 360,000 Notes payable Inventories 720,000 Line of credit Total current assets $1,260,000 Accruals Fixed assets 1,440,000 Total current liabilities Common stock Retained earnings Total assets $2,700,000 Total liabilities and equity Income Statement for December 31, 2016 $ 696,000 1,800,000 204,000 $2,700,000 Sales Operating costs $3,600,000 3,279,720 $ 320,280 18,280 EBIT Interest...
Financing Deficit Garlington Technologies Inc.'s 2018 financial statements are shown below: Balance Sheet as of December...
 Financing Deficit Garlington Technologies Inc.'s 2018 financial statements are shown below: Balance Sheet as of December 31, 2018 Cash $ 180,000 Accounts payable $ 360,000 Receivables 360,000 Notes payable 156,000 Inventories 720,000 Line of credit Total current assets $1,260,000 Accruals 180,000 Fixed assets 1,440,000 Total current liabilities $ 696,000 Common stock 1,800,000 Retained earnings 204,000 Total assets $2,700,000 Total liabilities and equity $2,700,000 Income Statement for December 31, 2018 Sales $3,600,000 Operating costs 3,279,720 EBIT $ 320,280 Interest 18,280 Pre-tax...
Financing Deficit Garlington Technologies Inc.'s 2018 financial statements are shown below: Balance Sheet as of December...
 Financing Deficit Garlington Technologies Inc.'s 2018 financial statements are shown below: Balance Sheet as of December 31, 2018 $360,000 156,000 Cash Receivables Inventories Total current assets Fixed assets $ 180,000 Accounts payable 360,000 Notes payable 720,000 Line of credit $1,260,000 Accruals 1,440,000 Total current Kabilities Common stock Retained earnings $2,700,000 Total liabilities and equity 180.000 $ 696.000 1,800,000 204,000 Total assets $2.700.000 Income Statement for December 31, 2018 Sales Operating costs EBIT Interest Pre-tax earings Taxes (40%) Net income Dividends...
Financing Deficit Garlington Technologies Inc.'s 2018 financial statements are shown below: Balance Sheet as of December...
 Financing Deficit Garlington Technologies Inc.'s 2018 financial statements are shown below: Balance Sheet as of December 31, 2018 Cash $ 180,000 Accounts payable $ 360,000 Receivables 360,000 Notes payable 156,000 Inventories 720,000 Line of credit Total current assets $1,260,000 Accruals 180,000 Fixed assets 1,440,000 Total current liabilities $ 696,000 Common stock 1,800,000 Retained earnings 204,000 Total assets $2,700,000 Total liabilities and equity $2,700,000 Income Statement for December 31, 2018 Sales Operating costs $3,600,000 3,279,720 $ 320,280 18,280 EBIT Interest Pre-tax...
Financing Deficit Garlington Technologies Inc.'s 2019 financial statements are shown below: Income Statement for December 31,...
Financing Deficit Garlington Technologies Inc.'s 2019 financial statements are shown below: Income Statement for December 31, 2019 Sales $4,000,000 Operating costs 3,200,000 EBIT $ 800,000 Interest 120,000 Pre-tax earnings $ 680,000 Taxes (25%) 170,000 Net income 510,000 Dividends $ 190,000 Balance Sheet as of December 31, 2019 Cash $ 160,000 Accounts payable $ 360,000 Receivables 360,000 Line of credit 0 Inventories 720,000 Accruals 200,000 Total CA $1,240,000 Total CL $ 560,000 Fixed assets 4,000,000 Long-term bonds 1,000,000 Total Assets $5,240,000...
Financing Deficit Garlington Technologies Inc.'s 2019 financial statements are shown below: Income Statement for December 31,...
Financing Deficit Garlington Technologies Inc.'s 2019 financial statements are shown below: Income Statement for December 31, 2019 Sales $4,000,000 Operating costs 3,200,000 EBIT $ 800,000 Interest 120,000 Pre-tax earnings $ 680,000 Taxes (25%) 170,000 Net income 510,000 Dividends $ 190,000 Balance Sheet as of December 31, 2019 Cash $ 160,000 Accounts payable $ 360,000 Receivables 360,000 Line of credit 0 Inventories 720,000 Accruals 200,000 Total CA $1,240,000 Total CL $ 560,000 Fixed assets 4,000,000 Long-term bonds 1,000,000 Total Assets $5,240,000 Common stock 1,100,000 RE 2,580,000 Total...
Financing Deficit Garlington Technologies Inc.'s 2019 financial statements are shown below: Income Statement for December 31,...
 Financing Deficit Garlington Technologies Inc.'s 2019 financial statements are shown below: Income Statement for December 31, 2019 Sales Operating costs EBIT Interest $4,000,000 3,200,000 $ 800,000 120,000 $ 680,000 Pre-tax earnings Taxes (25%) 170,000 Net income 510,000 Dividends $ 190,000 Balance Sheet as of December 31, 2019 Cash $ 160,000 Accounts payable $ 360,000 Receivables 360,000 Line of credit Inventories 720,000 Accruals 200,000 Total CA $1,240,000 Total CL $ 560,000 Fixed assets 4,000,000 Long-term bonds 1,000,000 Total Assets $5,240,000 Common...
Financing Deficit Garlington Technologies Inc.'s 2019 financial statements are shown below: Income Statement for December 31,...
Financing Deficit Garlington Technologies Inc.'s 2019 financial statements are shown below: Income Statement for December 31, 2019 Sales $4,000,000 Operating costs 3,200,000 EBIT $ 800,000 Interest 120,000 Pre-tax earnings $ 680,000 Taxes (25%) 170,000 Net income 510,000 Dividends $ 190,000 Balance Sheet as of December 31, 2019 Cash $ 160,000 Accounts payable $ 360,000 Receivables 360,000 Line of credit 0 Inventories 720,000 Accruals 200,000 Total CA $1,240,000 Total CL $ 560,000 Fixed assets 4,000,000 Long-term bonds 1,000,000 Total Assets $5,240,000 Common stock 1,100,000 RE 2,580,000 Total...
a.) Financing Deficit Garlington Technologies Inc.'s 2019 financial statements are shown below: Income Statement for December...
a.) Financing Deficit Garlington Technologies Inc.'s 2019 financial statements are shown below: Income Statement for December 31, 2019 Sales $4,000,000 Operating costs 3,200,000 EBIT $ 800,000 Interest 120,000 Pre-tax earnings $ 680,000 Taxes (25%) 170,000 Net income 510,000 Dividends $ 190,000 Balance Sheet as of December 31, 2019 Cash $ 160,000 Accounts payable $ 360,000 Receivables 360,000 Line of credit 0 Inventories 720,000 Accruals 200,000 Total CA $1,240,000 Total CL $ 560,000 Fixed assets 4,000,000 Long-term bonds 1,000,000 Total Assets $5,240,000 Common stock 1,100,000 RE 2,580,000...
Financing Deficit Garlington Technologies Inc.'s 2019 financial statements are shown below: Income Statement for December 31,...
Financing Deficit Garlington Technologies Inc.'s 2019 financial statements are shown below: Income Statement for December 31, 2019 Sales $4,000,000 Operating costs 3,200,000 EBIT $ 800,000 Interest 120,000 Pre-tax earnings $ 680,000 Taxes (25%) 170,000 Net income 510,000 Dividends $ 190,000 Balance Sheet as of December 31, 2019 Cash $ 160,000 Accounts payable $ 360,000 Receivables 360,000 Line of credit 0 Inventories 720,000 Accruals 200,000 Total CA $1,240,000 Total CL $ 560,000 Fixed assets 4,000,000 Long-term bonds 1,000,000 Total Assets $5,240,000 Common stock 1,100,000 RE 2,580,000 Total...
 Problem 12-09 Financing Deficit Garlington Technologies Inc.'s 2016 financial statements are shown below: Balance Sheet as of December 31, 2016 $360,000 156,000 180,000 Cash $ 180,000 Accounts payable Receivables 360,000 Notes payable Inventories 720,000 Line of credit Total current assets $1,260,000 Accruals Fixed assets 1,440,000 Total current liabilities Common stock Retained earnings Total assets $2,700,000 Total liabilities and equity Income Statement for December 31, 2016 $ 696,000 1,800,000 204,000 $2,700,000 Sales Operating costs $3,600,000 3,279,720 $ 320,280 18,280 EBIT Interest...
 Financing Deficit Garlington Technologies Inc.'s 2018 financial statements are shown below: Balance Sheet as of December 31, 2018 Cash $ 180,000 Accounts payable $ 360,000 Receivables 360,000 Notes payable 156,000 Inventories 720,000 Line of credit Total current assets $1,260,000 Accruals 180,000 Fixed assets 1,440,000 Total current liabilities $ 696,000 Common stock 1,800,000 Retained earnings 204,000 Total assets $2,700,000 Total liabilities and equity $2,700,000 Income Statement for December 31, 2018 Sales $3,600,000 Operating costs 3,279,720 EBIT $ 320,280 Interest 18,280 Pre-tax...
 Financing Deficit Garlington Technologies Inc.'s 2018 financial statements are shown below: Balance Sheet as of December 31, 2018 $360,000 156,000 Cash Receivables Inventories Total current assets Fixed assets $ 180,000 Accounts payable 360,000 Notes payable 720,000 Line of credit $1,260,000 Accruals 1,440,000 Total current Kabilities Common stock Retained earnings $2,700,000 Total liabilities and equity 180.000 $ 696.000 1,800,000 204,000 Total assets $2.700.000 Income Statement for December 31, 2018 Sales Operating costs EBIT Interest Pre-tax earings Taxes (40%) Net income Dividends...
 Financing Deficit Garlington Technologies Inc.'s 2018 financial statements are shown below: Balance Sheet as of December 31, 2018 Cash $ 180,000 Accounts payable $ 360,000 Receivables 360,000 Notes payable 156,000 Inventories 720,000 Line of credit Total current assets $1,260,000 Accruals 180,000 Fixed assets 1,440,000 Total current liabilities $ 696,000 Common stock 1,800,000 Retained earnings 204,000 Total assets $2,700,000 Total liabilities and equity $2,700,000 Income Statement for December 31, 2018 Sales Operating costs $3,600,000 3,279,720 $ 320,280 18,280 EBIT Interest Pre-tax...
 Financing Deficit Garlington Technologies Inc.'s 2019 financial statements are shown below: Income Statement for December 31, 2019 Sales Operating costs EBIT Interest $4,000,000 3,200,000 $ 800,000 120,000 $ 680,000 Pre-tax earnings Taxes (25%) 170,000 Net income 510,000 Dividends $ 190,000 Balance Sheet as of December 31, 2019 Cash $ 160,000 Accounts payable $ 360,000 Receivables 360,000 Line of credit Inventories 720,000 Accruals 200,000 Total CA $1,240,000 Total CL $ 560,000 Fixed assets 4,000,000 Long-term bonds 1,000,000 Total Assets $5,240,000 Common...
Most questions answered within 3 hours.
-
Timber Tour has a current ratio of 1.5 and a quick ratio of 0.8.
Given this,...
asked 1 minute from now -
c++
#include
using namespace std;
int main()
{
int n, x, num, j = 0;...
asked 32 seconds ago -
Hi
i need a research about any subject related to one of these
subject:
energy methods...
asked 13 minutes ago -
To develop a client/server application using TCP sockets and the
C programming language that is capable...
asked 11 minutes ago -
Your supply chain consists of one warehouse and N retail
locations. Assume that shipment lead time...
asked 15 minutes ago -
1. Why is it dangerous to extrapolate outside the experimental
region? 2. Discuss how the least...
asked 14 minutes ago -
Implement a program for SJF(non-preemptive) scheduling. Given n
processes with their burst times and Arrival Time,...
asked 39 minutes ago -
Question 1
A Chem 2111 student in a gravimetric analysis experiment
analyzed an iron ore by...
asked 42 minutes ago -
Draw a truth table of a D Flip-Flop that is falling edge, that
has a clock,...
asked 45 minutes ago -
Alteran Corporation purchased office equipment for $1.7 million
in 2015. The equipment is being depreciated over...
asked 51 minutes ago -
Briefly describe a scenario where it would be appropriate for a
researcher to do a one-tailed...
asked 52 minutes ago -
Determine what the key terms refer to in the following
survey.
To determine the average number...
asked 59 minutes ago