Question
Need to explain fully to get points
Homework Answers
Answer #1

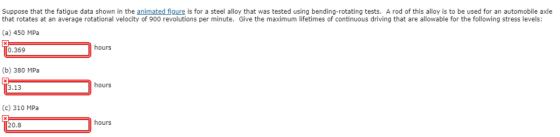
- For a stsess I of USO Mpa. me is 18.000 cycles (log Nf ч.as) 0.37S hr For a stress level of 380 Mpa ftie lifetime isa @sxos yle) C lag Nf= s.is) t For a stress level of ato MPa fodt For a stress leuel o ato Mna ftige ife time opp is IS imin 83 hr
Know the answer?
Add Answer to:
Need to explain fully to get points Suppose that the fatigue data shown in the animated figure is for a steel alloy that was tested using bending-rotating tests. A rod of this alloy is to be used for...
Not the answer you're looking for?
Ask your own homework help question.
Our experts will answer your question WITHIN MINUTES for Free.
Similar Homework Help Questions
Chapter 08, Problem 8.23 Suppose that the fatigue data shown in the Animated Figure: S-N Plot...
 Chapter 08, Problem 8.23 Suppose that the fatigue data shown in the Animated Figure: S-N Plot for Brass is for a brass alloy that was tested using bending-rotating tests. A rod of this alloy is to be used for an automobile axle that rotates at an average rotational velocity of 700 revolutions per minute. Give the maximum bending stress amplitude possible for each of the following lifetimes of the rod: (a) 1 year, MPa [The tolerance is +/-1096] (b) 1...
 Chapter 08, Problem 8.23 Suppose that the fatigue data shown in the Animated Figure: S-N Plot for Brass is for a brass alloy that was tested using bending-rotating tests. A rod of this alloy is to be used for an automobile axle that rotates at an average rotational velocity of 700 revolutions per minute. Give the maximum bending stress amplitude possible for each of the following lifetimes of the rod: (a) 1 year, MPa [The tolerance is +/-1096] (b) 1...
ADVERTISEMENT
Need Online Homework Help?
Ask
a QuestionGet Answers For Free
Most questions answered within 3 hours.
Most questions answered within 3 hours.
ADVERTISEMENT
ADVERTISEMENT
Active Questions
-
I need help with my javascript project, I've started on it but I
can't seem to...
asked 52 minutes ago -
Identification of unknown Bacteria by sequencing
rDNA
Having a little trouble understanding the PCR process. This...
asked 1 hour ago -
please answer the four of the questions
4. how are warehouse distribution centers, and cross-
docking...
asked 2 hours ago -
X Company currently makes a part and is considering buying it
from a company that has...
asked 3 hours ago -
The height of a helicopter above the ground is given by h =
2.90t3, where h...
asked 3 hours ago -
Consider the natural join of the relation R(A,B) and S(A,C) on
attribute A. Neither relations have...
asked 3 hours ago -
You are a network planner tasked with developing an IP structure
for the following networks. The...
asked 4 hours ago -
Christmas Express makes wreaths in batch sizes of 30. The
cutting & assembly process takes 4...
asked 4 hours ago -
Suppose a brewery has a filling machine that fills 12-ounce
bottles of beer. It is known...
asked 6 hours ago -
For this problem, carry at least four digits after the decimal
in your calculations. Answers may...
asked 9 hours ago -
Ask a user for three positive integer numbers. Use an input
validation loop to make sure...
asked 9 hours ago -
The most primitive form of data from data analysis perspective
is a. nominal scale b. ordinal...
asked 9 hours ago
ADVERTISEMENT