

Homework Answers

Add Answer to:
Chapter 08, Problem 8.23 Suppose that the fatigue data shown in the Animated Figure: S-N Plot...
Need to explain fully to get points Suppose that the fatigue data shown in the animated figure is for a steel alloy that was tested using bending-rotating tests. A rod of this alloy is to be used for...
 Need to explain fully to get points
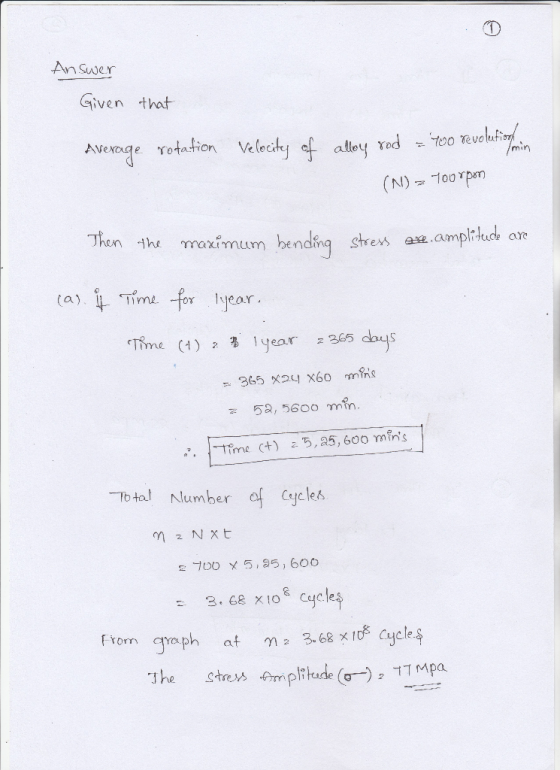
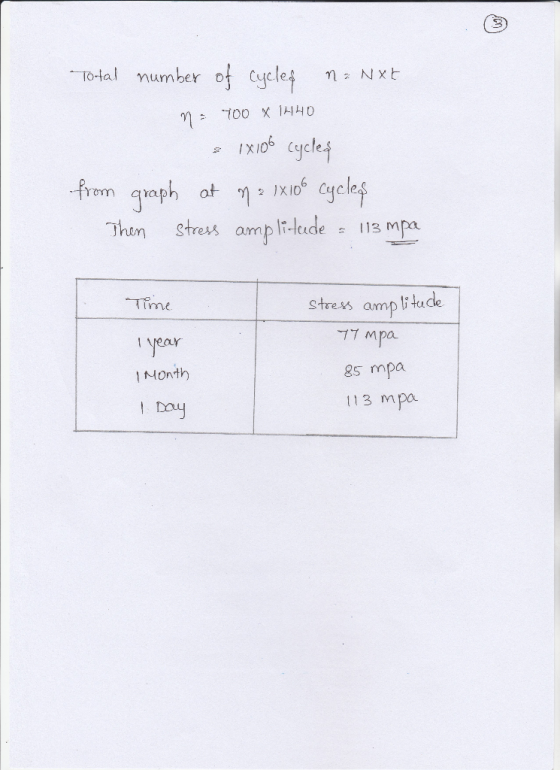
Suppose that the fatigue data shown in the animated figure is for a steel alloy that was tested using bending-rotating tests. A rod of this alloy is to be used for an automobile axle that rotates at an average rotational velocity of 900 revolutions per minute. Give the maximum lifetimes of continuous driving that are allowable for the following stress levels: (a) 450 MPa hours 0.369 (b) 380 MPa hours 3.13 (c) 310...
Need to explain fully to get points
Suppose that the fatigue data shown in the animated figure is for a steel alloy that was tested using bending-rotating tests. A rod of this alloy is to be used for an automobile axle that rotates at an average rotational velocity of 900 revolutions per minute. Give the maximum lifetimes of continuous driving that are allowable for the following stress levels: (a) 450 MPa hours 0.369 (b) 380 MPa hours 3.13 (c) 310...
Problem 9.26 XIncorrect. Using the S-N Animated Figure for a brass alloy determine the following ...
 Problem 9.26 XIncorrect. Using the S-N Animated Figure for a brass alloy determine the following (a) the fatigue strength at 30000000 cycles MPa 90 (b) the fatigue life for 126 MPa 1E6 cycles Cycles to failure 1E 4 Stress 60 MPa 180 160 140 120 100 80 ιρ4 105 106 107 108 109 1010 Cycles to failure
Problem 9.26 XIncorrect. Using the S-N Animated Figure for a brass alloy determine the following (a) the fatigue strength at 30000000 cycles MPa...
Problem 9.26 XIncorrect. Using the S-N Animated Figure for a brass alloy determine the following (a) the fatigue strength at 30000000 cycles MPa 90 (b) the fatigue life for 126 MPa 1E6 cycles Cycles to failure 1E 4 Stress 60 MPa 180 160 140 120 100 80 ιρ4 105 106 107 108 109 1010 Cycles to failure
Problem 9.26 XIncorrect. Using the S-N Animated Figure for a brass alloy determine the following (a) the fatigue strength at 30000000 cycles MPa...
A cylindrical bar of ductile cast iron is subjected to reversed and rotating-bending tests, test results (i.e., S-N behavior) are shown in Animated Figure 8.21. If the bar diameter is 8.52 mm, determi...
 A cylindrical bar of ductile cast iron is subjected to reversed
and rotating-bending tests, test results (i.e., S-N
behavior) are shown in Animated Figure 8.21. If the bar diameter is
8.52 mm, determine the maximum cyclic load that may be applied to
ensure that fatigue failure will not occur. Assume a factor of
safety of 2.21 and that the distance between loadbearing points is
55.3 mm.
answer in N
We were unable to transcribe this imageReferences Cycles to failure 3.2E...
A cylindrical bar of ductile cast iron is subjected to reversed
and rotating-bending tests, test results (i.e., S-N
behavior) are shown in Animated Figure 8.21. If the bar diameter is
8.52 mm, determine the maximum cyclic load that may be applied to
ensure that fatigue failure will not occur. Assume a factor of
safety of 2.21 and that the distance between loadbearing points is
55.3 mm.
answer in N
We were unable to transcribe this imageReferences Cycles to failure 3.2E...
The fatigue data for a ductile cast iron are given as follows: (7 pts Stress Amplitude...
 The fatigue data for a ductile cast iron are given as follows: (7 pts Stress Amplitude IMPa (ksi 248 (36.0) 236 (34.2) 224 (32.5 213 (30.9) 201 (29.1) 93 (28.0) 193 (28.0 193 (28.0) Cycles to Failure I x 10 3 x 10 1 x 10 I x 107 3 x 10⁷ 3 x 10 a) Make an S-N plot (stress amplitude versus logarithm cycles to failure) using these data. b) What is the fatigue limit for this alloy? (c)...
Q6. (a) Three identical fatigue specimens (denoted A, B and C) are fabricated from a non-ferrous...
 Q6. (a) Three identical fatigue specimens (denoted A, B and C) are fabricated from a non-ferrous alloy. Each is subjected to one of the maximum- minimum stress cycles listed in Table 26 (the frequency is the same for all tests) Table 26 Specimen Omax (MPa) Omin (MPa) A +450 -150 +300 -300 +500 -200 Rank the three specimens in terms of their fatigue lifetimes (highest to lowest). Justify this ranking [5 marks] (b) A cylindrical tie rod of diameter 20...
 Need to explain fully to get points
Suppose that the fatigue data shown in the animated figure is for a steel alloy that was tested using bending-rotating tests. A rod of this alloy is to be used for an automobile axle that rotates at an average rotational velocity of 900 revolutions per minute. Give the maximum lifetimes of continuous driving that are allowable for the following stress levels: (a) 450 MPa hours 0.369 (b) 380 MPa hours 3.13 (c) 310...
Need to explain fully to get points
Suppose that the fatigue data shown in the animated figure is for a steel alloy that was tested using bending-rotating tests. A rod of this alloy is to be used for an automobile axle that rotates at an average rotational velocity of 900 revolutions per minute. Give the maximum lifetimes of continuous driving that are allowable for the following stress levels: (a) 450 MPa hours 0.369 (b) 380 MPa hours 3.13 (c) 310...
 Problem 9.26 XIncorrect. Using the S-N Animated Figure for a brass alloy determine the following (a) the fatigue strength at 30000000 cycles MPa 90 (b) the fatigue life for 126 MPa 1E6 cycles Cycles to failure 1E 4 Stress 60 MPa 180 160 140 120 100 80 ιρ4 105 106 107 108 109 1010 Cycles to failure
Problem 9.26 XIncorrect. Using the S-N Animated Figure for a brass alloy determine the following (a) the fatigue strength at 30000000 cycles MPa...
Problem 9.26 XIncorrect. Using the S-N Animated Figure for a brass alloy determine the following (a) the fatigue strength at 30000000 cycles MPa 90 (b) the fatigue life for 126 MPa 1E6 cycles Cycles to failure 1E 4 Stress 60 MPa 180 160 140 120 100 80 ιρ4 105 106 107 108 109 1010 Cycles to failure
Problem 9.26 XIncorrect. Using the S-N Animated Figure for a brass alloy determine the following (a) the fatigue strength at 30000000 cycles MPa...
 A cylindrical bar of ductile cast iron is subjected to reversed
and rotating-bending tests, test results (i.e., S-N
behavior) are shown in Animated Figure 8.21. If the bar diameter is
8.52 mm, determine the maximum cyclic load that may be applied to
ensure that fatigue failure will not occur. Assume a factor of
safety of 2.21 and that the distance between loadbearing points is
55.3 mm.
answer in N
We were unable to transcribe this imageReferences Cycles to failure 3.2E...
A cylindrical bar of ductile cast iron is subjected to reversed
and rotating-bending tests, test results (i.e., S-N
behavior) are shown in Animated Figure 8.21. If the bar diameter is
8.52 mm, determine the maximum cyclic load that may be applied to
ensure that fatigue failure will not occur. Assume a factor of
safety of 2.21 and that the distance between loadbearing points is
55.3 mm.
answer in N
We were unable to transcribe this imageReferences Cycles to failure 3.2E...
 The fatigue data for a ductile cast iron are given as follows: (7 pts Stress Amplitude IMPa (ksi 248 (36.0) 236 (34.2) 224 (32.5 213 (30.9) 201 (29.1) 93 (28.0) 193 (28.0 193 (28.0) Cycles to Failure I x 10 3 x 10 1 x 10 I x 107 3 x 10⁷ 3 x 10 a) Make an S-N plot (stress amplitude versus logarithm cycles to failure) using these data. b) What is the fatigue limit for this alloy? (c)...
 Q6. (a) Three identical fatigue specimens (denoted A, B and C) are fabricated from a non-ferrous alloy. Each is subjected to one of the maximum- minimum stress cycles listed in Table 26 (the frequency is the same for all tests) Table 26 Specimen Omax (MPa) Omin (MPa) A +450 -150 +300 -300 +500 -200 Rank the three specimens in terms of their fatigue lifetimes (highest to lowest). Justify this ranking [5 marks] (b) A cylindrical tie rod of diameter 20...
Most questions answered within 3 hours.
-
Lower Equitorial and Upper Equitorial are the same except Lower
Equitorial has a larger capital stock....
asked 2 minutes ago -
how do you think that pH of a jar where you have added a certain
amount...
asked 12 minutes ago -
If the Federal Reserve increases the reserve requirement, what
will happen to the Money Supply in...
asked 7 minutes ago -
Suppose that market demand for a good is given by Q = 9 - 0.3 P...
asked 14 minutes ago -
two thin lenses are separated by a distance x. The first lens
has a focal length...
asked 15 minutes ago -
The computer that controls a bank's automatic teller machine
crashes a mean of 0.6 times per...
asked 19 minutes ago -
`1) How is -9 (base 10) represented in 8-bit two's complement
notation?
a) 00001001
b)11110111
c)11110110...
asked 28 minutes ago -
A 10.000 g sample of water contains 11.19% H by mass. what
should be the %H...
asked 46 minutes ago -
Consider an investment game among 2 players. Each player can
either invest,
i, or not invest,-i....
asked 43 minutes ago -
The time taken to complete a particular task is normally
distributed with a standard deviation of...
asked 53 minutes ago -
we have heteroskedasticity in a regression when:
When the variance of error terms changes when an...
asked 1 hour ago -
Explain some different types of fungi. State the different
divisions undergo by fungi.
asked 1 hour ago