


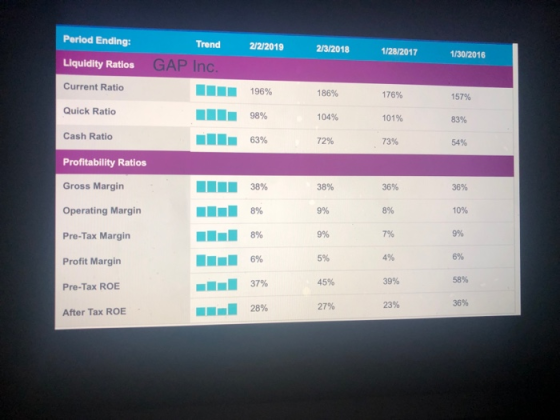

Period Ending: Trend 2r3/2018 1/28/2017 1/30/2016 GAP Inc Liquidity Ratios 186% 104% 72% 15796 83% 54% 196% 176% 101% 73% Current Ratio | 98% Quick Ratio Cash Ratio Profitability Ratios Gross Margin Operating Margin Pre-Tax Margin Profit Margin Pre-Tax ROE After Tax ROE i 63% 36% 10% 9% 6% 58% 36% 36% 38% 996 9% 5% 45% 27% 8% 7% 4% 39% 23%
Period Ending: Total Revenue GAP Inc Cost of Revenue Gross Profit Operating Expenses Research and Development Sales, General and Admin Non-Recurring Items Other Operating Items Operating Income Add'l incomelexpense items Earnings Before Interest and Tax Interest Expense Earnings Before Tax Income Tax Minority Interest Equity Earnings/Loss Unconsolidated Trend 222019 ม32018 1.282017 บ3O/2016 $16,580,000 $15,855,000 $15,516.000 $15,797000 $10.258,000 9,789,000 $9,876.000 $10,077,000 11 $6,322,000 ss,066.000 ss,640,000 ss,720,000 SO so s0 s0 so s0 S0 S0 So s0 5o $1,362,000 $1,479,000 $1,191,000 $1,524,000 IL-$33,000 $19,000 $8,000 s6,00 $1,395,000 $1,498,000 $1,199,000 $1,530000 $73,000 $74,000 $75,000$59,000 $1,322.000 $1,424,000 $1,124,000 $1,471,000 $319,000 $576,000 $448,000 $551,000 $o SO S0 so Subsidiary Not Income-Cont. Operations Net Income Net Income Applicable to Common $1,003,000 $848,000 $676,000 $920,000 $1,003,000 $848,000 $676,000 $920,000 $1,003,000 $848,000 $676,00 $920,000 Shareholders
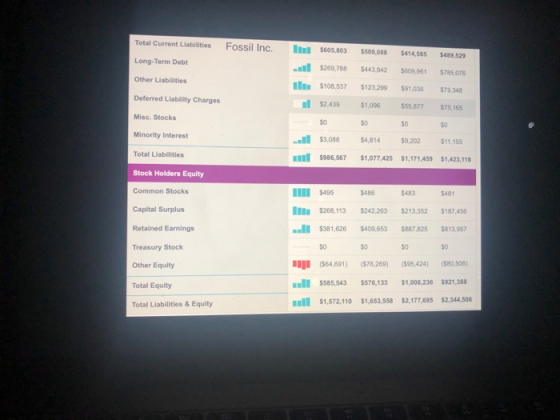
Total Current Liabilities Fossil Inc. $605,803 $509,088 $414,585 $489,529 Long-Term Debt Other Liabilities Deferred Liability Charges Misc. Stocks Minority Interest Total Liabilities Stock Holders Equity Common Stocks Capital Surplus Retained Earnings Treasury Stock Other Equity Total Equity Total Liabilities & Equity $269,788 $443,942 $609,961 $785,076 $108,537 $123.299 $91,036 $73.348 $2,439 $1,096 $55,877 $75,165 S0 $0 so so $3,088 $4814 $9.202 $11,155 $986,567 $1,077,425 $1,171,459 $1,423,118 $495 $488 $483 $481 $268,113 $242.263 $213,352 $187.458 $381,626 $409,653 $887,825 $813,957 SO $o so So ($64,691) (76.269) (5,424) (80,508) $585,543 $576,133 $1,006,236 $921,388 $1,572,110 $1,653,558 $2,177,695 $2,344,506
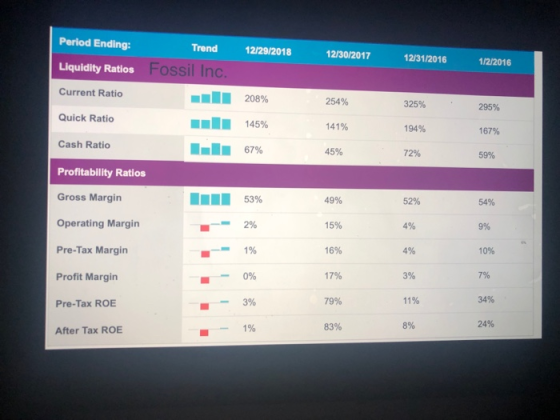
Period Ending: Liquidity Ratios Current Ratio Quick Ratio Cash Ratio Profitability Ratios Gross Margin Operating Margin Pre-Tax Margin Profit Margin Pre-Tax ROE After Tax ROE Trend 12/29/2018 2002017 12/31/2016 1/2/2016 Fossil Inc. 208% 254% 141% 45% 325% 194% 72% 295% 167% ■■■■ 6796 59% 54% 9% 10% 52% 4% 4% 3% 11% 8% 49% 15% 16% 17% 79% 83% 5396 7% -096 3% ■一1% 34% 24%
Period Ending Trend 2/2/2019 2/3/2018 1/28/2017 1/30/2016 Liquidity Ratios GAP Inc Current Ratio Quick Ratio Cash Ratio 186% 104% 72% 176% 15796 101% 83% E 63% 73% 54% Profitability Ratios Gross Margin Operating Margin Pre-Tax Margin Profit Margin Pre-Tax ROE After Tax ROE 38% 9% 9% 5% 45% 27% 36% 10% 9% 36% 8% 7% 4% 39% 23% 6% 58% 36%
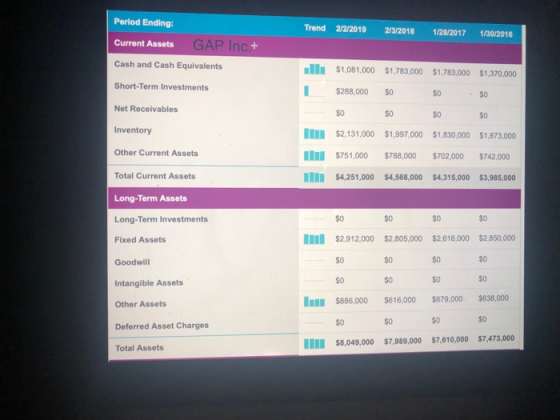
Period Ending: Current Assets Cash and Cash Equivalents Short-Term Investments Net Receivables Inventory Other Current Assets Trend 2/2/2019 ขม2018 1/28/2017 1/30/2016 GAP Inc $1,081,000 $1,783,000 $%1,783,000 $1,370,000 $288,000 S $0 SO S0 $2,131,000 $1,997,000 $1,830,000 $1,873,000 $751,000 $788,000 $702,000 $742,000 Total Current Assets Long-Term Assets Long-Term Investments Fixed Assets Goodwill Intangible Assets Other Assets $4,251,000 $4,568,000 $4,315,000 $3,985,000 So $2,912,000 $2,805,000 $2,616,000 $2,850,000 so sO SO So s0 $0 so s0 $886,000 $616,000 $679,000 $638,000 $0 SO Deferred Asset Charges $8,049,000 $7,989,000 $7,610,000 $7,473,00o Total Assets
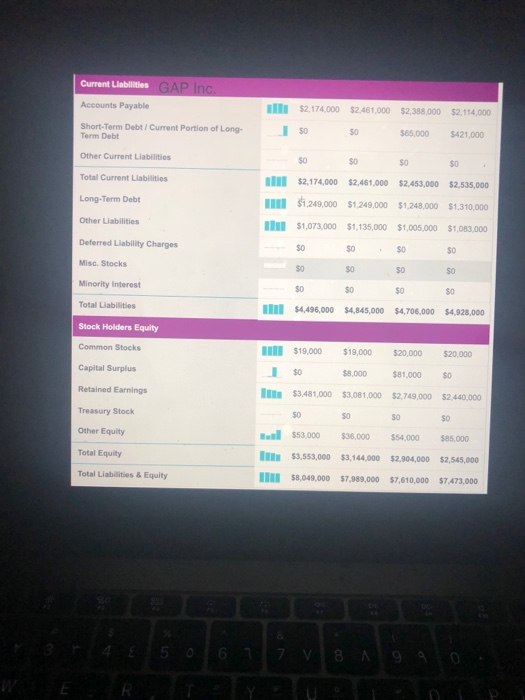
GAP Inc Current Lilablities Accounts Payable Short-Term Debt /Current Portion of Long- $2,174,000 $2,461,000 $2,388.000 $2,114,000 S0$0$65,000 1.000 Term Debt Other Current Liabilities Total Current Liabilities Long-Term Debt Other Liabilities Deferred Liability Charges Misc. Stocks Minority Interest Total Liabilities Stock Holders Equity Common Stocks Capital Surplus Retained Earnings Treasury Stock Other Equity Total Equity Total Liabilities & Equity so So SO $2,174,000 $2,461,000 $2,453,000 $2,535,000 1111 ร้า249,000 $1249,000 $1,248,000 $1,310,000 $1,073000 $1,135,000 $1,005,000 $1,083,000 s0 So S0 so So S0 $0 S0 so IIII $4,496,000 $4,845,000 $4,706,000 $4,928,000 $19.000 $19,000 $20,000 $20,000 $8,000 $81,000 $3,481,000 $3,081,000 $2,749,000 $2,440,000 so so $53,000 $36,000 $54,000 $85,000 $3,553,000 $3,144,000 $2,904,000 $2,545,000 $8,049,000 $7,989,000 $7,610,000 $7,473,000
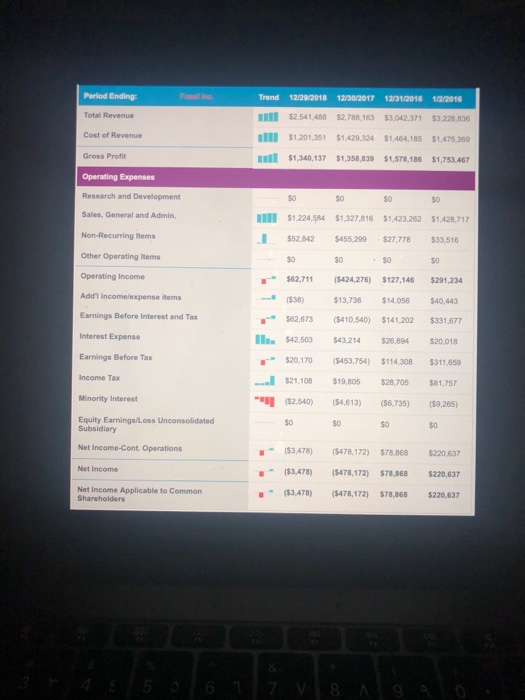
Period Ending: Total Revenue Cost of Revenue Gross Profit Trend 12290018 12002017 เม012016 1aa016 $2.541,488 $2,788,163 $3,042,371 $3.228.836 $1,201,351 $1,429,324 $1,464,185 $1,475,369 $1,340,137 $1,358,839 $1,578,186 $1,753,467 Operating Expenses Research and Development Sales, General and Admin Non-Recurring Items Other Operating Items Operating Income Add'l incomelexpense items Earnings Before Interest and Tax Interest Expense Earnings Before Tax Income Tax SO sO so $1,224 584 $1,327,816 $1.423.262 $1,428,717 $52842 $455,299 $27,778 $33,516 $0 so SO $0 $62,711 (424,276) $127,146 $291,.234 ($38) $13,736 $14,056$40,443 $62,673 ($410.540) $141,202 $331,677 $42.503 $43,214 $26,894 $20,018 $20,170 ($453,754) $114,308 $311,659 $21,108 $19,805$28,705 $81,757 $2.540) (4,613) (6,735) ($9.265) Minority Interest Equity Earnings/Loss Unconsolidated so So so So Subsidiary Net Income-Cont. Operations Net Income Net Income Applicable to Common ($3,478) ($478.172) $78.868 $220,637 ($3,478) ($478,172) $78,868 $220,637 ($3,478) ($478,172) $78,868 $220,637 Shareholders
Period Ending: Current Assets Cash and Cash Equivalents Short-Term Investments Net Receivables Trend 12/29/2018 12/30/2017 12/31/2016 1/2/2016 Fossil Inc $403,373 $231,.244 $297.330 $289,275 s0 $328,022 $367,013 $375,520 $370.761 $377,622 $573,88 $542487 $625,344 $149,552 $118,943 $131,953 $157290 $1,258,569 $1,290,988 $1,347,290 $1,442,670 so so s0 Other Current Assets Total Current Assets Long-Term Assets Long-Term Investments Fixed Assets Goodwill Intangible Assets Other Assets Deferred Asset Charges Total Assets Current Liabilities Accounts Payable Short-Term Debt / Current Portion of Long$126,427 so SO s0 S0 $183,203 $219,742 $273,851 $326,370 Il So 355,263 $359,394 $133,426 $147,642 $210,493 $227 227 so so so so $1,575,198 $1,658,372 $2,186,897 $2,355,661 $479.376 $0944 $388.217 $466.370 $2,144 $26,368 23,1 Term Debt Other Current Liabilities S0 S0
Homework Answers
Fossil Inc.
2016
Current ratio = Current Assets / Current Liabilities
Current ratio = 1347290 / 414585
Current ratio = 3.25 or 325%
Quick ratio = (Current asset- inventory) / Current liabilities
Quick ratio = (1347290 - 542487) / 414585
Quick ratio = = 1.94 or 194%
2017
Current ratio = 1290988 / 509088
Current ratio = 2.54 or 254%
Quick ratio = ( 1290988 - 573788) / 509088
Quick ratio = 1.41 or 141%
For FOSSIL , the current and quick ratio is above 1, which indicates the company has enough liquidity to meet the company's short term obligations. High ratios indicate the company has enough cash for any sort comings if any.
GAP
2016
Current ratio = 4315000 / 2453000
Current ratio = 1.76 or 176%
Quick ratio = (4315000 - 1830000) / 2453000
Quick ratio = 1.01 or 101%
2017
Current ratio = 4568000 / 2461000
Current ratio = 1.86 or 186%
Quick ratio = (4568000 - 1997000) / 2461000
Quick ratio = 1.04 or 104%
For GAP , the current and quick ratio is also above 1, but is less than fossil and is at border line as the optimal ratio is 1. The company's liquid profile is good but the company should continue to maintain this and work towards the improvement of its liquidity position to prevent any upcoming shortfall in terms of liquid cash.
Add Answer to:
Why are Fossil Inc. and Gap Inc.'s 2016 and 2017 current and quick ratios based on the latest available financial statements? What can you say about the companies' liquidity...
Liquidity ratios explain a company’s…..( text and citation needed) 1 The specific Liquidity ratios: Current and...
 Liquidity ratios explain a company’s…..( text and citation
needed) 1 The specific Liquidity ratios: Current and & Quick
ratios mean what? ….. (see and cite text) 2 Wal-Mart’s Liquidity
ratios: what is the three-year trend? 3 Which trend needs
elaboration? … To continue this positive trend Wal-Mart should Or
…. To address this negative trend Wal-Mart must
WalMart Inc Balance sheet(s) WalMart Inc Income Statement s) Period Ending ..2015 .2014 ..2013 Supplier Purchases) Cost of Goods Sold Selling and General...
Liquidity ratios explain a company’s…..( text and citation
needed) 1 The specific Liquidity ratios: Current and & Quick
ratios mean what? ….. (see and cite text) 2 Wal-Mart’s Liquidity
ratios: what is the three-year trend? 3 Which trend needs
elaboration? … To continue this positive trend Wal-Mart should Or
…. To address this negative trend Wal-Mart must
WalMart Inc Balance sheet(s) WalMart Inc Income Statement s) Period Ending ..2015 .2014 ..2013 Supplier Purchases) Cost of Goods Sold Selling and General...
Financial ratios: Liquidity. The financial statements for Tyler Toys, Inc. are shown below: Calculate the current...
 Financial ratios: Liquidity. The financial statements for
Tyler Toys, Inc. are shown below: Calculate the current ratio,
quick ratio, and cash ratio for Tyler Toys for 2013 and 2014.
Should any of these ratios or the change in a ratio warrant concern
for the managers of Tyler Toys or the shareholders?
Tyler Toys, Inc.
Income Statement for Years Ending December 31, 2013 and
2014
2014
2013
Revenue
$14,146,664
$13,566,518
Cost of goods sold
$-8,447,425
$-8,131,347
Selling, general, and
administrative expenses...
Financial ratios: Liquidity. The financial statements for
Tyler Toys, Inc. are shown below: Calculate the current ratio,
quick ratio, and cash ratio for Tyler Toys for 2013 and 2014.
Should any of these ratios or the change in a ratio warrant concern
for the managers of Tyler Toys or the shareholders?
Tyler Toys, Inc.
Income Statement for Years Ending December 31, 2013 and
2014
2014
2013
Revenue
$14,146,664
$13,566,518
Cost of goods sold
$-8,447,425
$-8,131,347
Selling, general, and
administrative expenses...
Calculate the following ratios based on Wendy's 2017 and 2018 financial statements and comment on the...
 Calculate the following ratios based on Wendy's 2017 and 2018
financial statements and comment on the differences between FY 2017
and FY 2018.
Wendy's
FY 2017
FY 2018
Liquidity
Current Ratio:
Quick Ratio:
Comments on the companies' liquidity - what do the numbers
say?
Asset Management
Total Asset Turnover:
Avg Collection Period:
Comments on the companies' asset management - what do the numbers
say?
Debt Management
Total Debt to Total Assets:
Times Interest Earned:
Comments on the companies' debt management...
Calculate the following ratios based on Wendy's 2017 and 2018
financial statements and comment on the differences between FY 2017
and FY 2018.
Wendy's
FY 2017
FY 2018
Liquidity
Current Ratio:
Quick Ratio:
Comments on the companies' liquidity - what do the numbers
say?
Asset Management
Total Asset Turnover:
Avg Collection Period:
Comments on the companies' asset management - what do the numbers
say?
Debt Management
Total Debt to Total Assets:
Times Interest Earned:
Comments on the companies' debt management...
Refer to the January 29, 2016, income statement and balance sheet of Lowe's Companies Inc. below....
 Refer to the January 29, 2016, income statement and balance sheet of Lowe's Companies Inc. below. LOWE'S COMPANIES INC. Income Statement (In millions) For Fiscal Year Ended January 29, 2016 Net sales.............................................. Cost of sales.................................. ... Gross margin ....................................... Selling, general and administrative Depreciation.. tion......................................... Interest-net........................................ Total expenses... Pretax earnings Income tax provision ... Net earnings $59,074 38,504 20,570 14,115 1,484 552 16.151 4,419 1,873 $ 2,546 Required: Compute the following liquidity, solvency, and coverage ratios for Lowe's Companies. Interpret...
Wal-Mart’s Liquidity ratios: what is the three-year trend? Walmart Inc Balance sheet(s) Walmart Inc Income Statement(s)...
 Wal-Mart’s Liquidity ratios: what is the three-year trend?
Walmart Inc Balance sheet(s) Walmart Inc Income Statement(s) ..2015 ..2014 ..2013 9,135,000 6,778,000 45,141,000 2,224,000 63,278,000 116,655,000 18,102,000 5,671,000 203,706,000 7,281,000 6,677,000 44,858,000 2,369,000 61,185,000 117,907,000 19,510,000 6,149,000 204,751,000 7,781,000 6,768,000 43,803,000 1,588,000 59,940,000 116,681,000 20,497,000 5,987,000 203,105,000 Period Ending Assets Current Assets Cash And Cash Equivalents Accounts Receivable Inventory Other Current Assets Total Current Assets Fixed Assets Goodwill Other Assets Total Assets Liabilities Current Liabilities Accounts Payable Current Portion Long Term...
Wal-Mart’s Liquidity ratios: what is the three-year trend?
Walmart Inc Balance sheet(s) Walmart Inc Income Statement(s) ..2015 ..2014 ..2013 9,135,000 6,778,000 45,141,000 2,224,000 63,278,000 116,655,000 18,102,000 5,671,000 203,706,000 7,281,000 6,677,000 44,858,000 2,369,000 61,185,000 117,907,000 19,510,000 6,149,000 204,751,000 7,781,000 6,768,000 43,803,000 1,588,000 59,940,000 116,681,000 20,497,000 5,987,000 203,105,000 Period Ending Assets Current Assets Cash And Cash Equivalents Accounts Receivable Inventory Other Current Assets Total Current Assets Fixed Assets Goodwill Other Assets Total Assets Liabilities Current Liabilities Accounts Payable Current Portion Long Term...
Using the following information: Calculate the following ratios for Urban Outfitters for both 2016 and 2017...
 Using the following information:
Calculate the following ratios for Urban Outfitters for
both 2016 and
2017 (show calculations):
a. Gross profit margin
b. Operating profit margin
c. Net profit margin
d. Times interest earned coverage
e. Return on shareholders’ equity
f. Return on assets
g. Debt-to-equity ratio
h. Days of inventory
i. Inventory turnover ratio
j. Average collection period
Consolidated Income Statements for Urban ters, Inc. 2016 2017 $3.545.794 $3,445,134 Net sales (total revenue) 2,301,181 2,243,232 Cost of sales 906,086...
Using the following information:
Calculate the following ratios for Urban Outfitters for
both 2016 and
2017 (show calculations):
a. Gross profit margin
b. Operating profit margin
c. Net profit margin
d. Times interest earned coverage
e. Return on shareholders’ equity
f. Return on assets
g. Debt-to-equity ratio
h. Days of inventory
i. Inventory turnover ratio
j. Average collection period
Consolidated Income Statements for Urban ters, Inc. 2016 2017 $3.545.794 $3,445,134 Net sales (total revenue) 2,301,181 2,243,232 Cost of sales 906,086...
ADDITIONAL FUNDS NEEDED Morrissey Technologies Inc.'s 2016 financial statements are shown here. Morrissey Technologies Inc.: Balance...
ADDITIONAL FUNDS NEEDED Morrissey Technologies Inc.'s 2016 financial statements are shown here. Morrissey Technologies Inc.: Balance Sheet as of December 31, 2016 Cash $180,000 Accounts payable $360,000 Receivables 360,000 Notes payable 56,000 Inventories 720,000 Accrued liabilities 180,000 Total current assets $1,260,000 Total current liabilities $596,000 Long-term debt 100,000 Fixed assets 1,440,000 Common stock 1,800,000 Retained earnings 204,000 Total assets $2,700,000 Total liabilities and equity $2,700,000 Morrissey Technologies Inc.: Income Statement for December 31, 2016 Sales $3,600,000 Operating costs including depreciation...
Compute and Interpret Liquidity, Solvency and Coverage Ratios Balance sheets and income statements for Lockheed Martin...
 Compute and Interpret Liquidity, Solvency and Coverage Ratios Balance sheets and income statements for Lockheed Martin Corporation follow. Refer to these financial statements to answer the requirements. Consolidated Statements of Earnings Year Ended December 31 (In millions) 2016 2015 Net sales Products $ 40,365 $ 34,868 Services 6,883 5,668 Total net sales 47,248 40,536 Cost of sales Products (36,616) (31,091) Services (6,040) (4,824) Severance and other charges (80) (82) Other unallocated costs 550 (47) Total cost of sales (42,186) (36,044)...
QUESTION 3 From following financial statements, calculate following ratios and analyse the current year and previous...
 QUESTION 3 From following financial statements, calculate following ratios and analyse the current year and previous year performance a) Current ratio. b) Days sales outstanding (DSO). (Sales 2017 RM500m & Sales 2018 RM600m) c) Inventory turnover ratio d) Total debt to assets e) Return on assets (ROA) (Net income 2017 RM42m &Net income 2018 RM58m) Moon Inc. Balance Sheet (RM millions) as at December 31, 2015 and 2016 2015 21 51 2016 20 84 Cash Accounts receivable Inventory Prepaid expenses...
Balance sheets and income statements for Nordstrom, Inc., follow. Refer to these financial statements to answer the requ...
Balance sheets and income statements for Nordstrom, Inc., follow. Refer to these financial statements to answer the requirements. Nordstrom, Inc. Consolidated Statements of Earnings For Fiscal Years Ended ($ millions) 2016 2015 2014 Net Sales $14,095 $13,110 $12,166 Credit card revenues 342 396 374 Total revenues 14,437 13,506 12,540 Cost of sales and related buying and occupancy costs (9,168) (8,406) (7,737) Selling, general and administrative expenses (4,168) (3,777) (3,453) Earnings before interest and income taxes 1,101 1,323 1,350 Interest expense,...
 Liquidity ratios explain a company’s…..( text and citation
needed) 1 The specific Liquidity ratios: Current and & Quick
ratios mean what? ….. (see and cite text) 2 Wal-Mart’s Liquidity
ratios: what is the three-year trend? 3 Which trend needs
elaboration? … To continue this positive trend Wal-Mart should Or
…. To address this negative trend Wal-Mart must
WalMart Inc Balance sheet(s) WalMart Inc Income Statement s) Period Ending ..2015 .2014 ..2013 Supplier Purchases) Cost of Goods Sold Selling and General...
Liquidity ratios explain a company’s…..( text and citation
needed) 1 The specific Liquidity ratios: Current and & Quick
ratios mean what? ….. (see and cite text) 2 Wal-Mart’s Liquidity
ratios: what is the three-year trend? 3 Which trend needs
elaboration? … To continue this positive trend Wal-Mart should Or
…. To address this negative trend Wal-Mart must
WalMart Inc Balance sheet(s) WalMart Inc Income Statement s) Period Ending ..2015 .2014 ..2013 Supplier Purchases) Cost of Goods Sold Selling and General...
 Financial ratios: Liquidity. The financial statements for
Tyler Toys, Inc. are shown below: Calculate the current ratio,
quick ratio, and cash ratio for Tyler Toys for 2013 and 2014.
Should any of these ratios or the change in a ratio warrant concern
for the managers of Tyler Toys or the shareholders?
Tyler Toys, Inc.
Income Statement for Years Ending December 31, 2013 and
2014
2014
2013
Revenue
$14,146,664
$13,566,518
Cost of goods sold
$-8,447,425
$-8,131,347
Selling, general, and
administrative expenses...
Financial ratios: Liquidity. The financial statements for
Tyler Toys, Inc. are shown below: Calculate the current ratio,
quick ratio, and cash ratio for Tyler Toys for 2013 and 2014.
Should any of these ratios or the change in a ratio warrant concern
for the managers of Tyler Toys or the shareholders?
Tyler Toys, Inc.
Income Statement for Years Ending December 31, 2013 and
2014
2014
2013
Revenue
$14,146,664
$13,566,518
Cost of goods sold
$-8,447,425
$-8,131,347
Selling, general, and
administrative expenses...
 Calculate the following ratios based on Wendy's 2017 and 2018
financial statements and comment on the differences between FY 2017
and FY 2018.
Wendy's
FY 2017
FY 2018
Liquidity
Current Ratio:
Quick Ratio:
Comments on the companies' liquidity - what do the numbers
say?
Asset Management
Total Asset Turnover:
Avg Collection Period:
Comments on the companies' asset management - what do the numbers
say?
Debt Management
Total Debt to Total Assets:
Times Interest Earned:
Comments on the companies' debt management...
Calculate the following ratios based on Wendy's 2017 and 2018
financial statements and comment on the differences between FY 2017
and FY 2018.
Wendy's
FY 2017
FY 2018
Liquidity
Current Ratio:
Quick Ratio:
Comments on the companies' liquidity - what do the numbers
say?
Asset Management
Total Asset Turnover:
Avg Collection Period:
Comments on the companies' asset management - what do the numbers
say?
Debt Management
Total Debt to Total Assets:
Times Interest Earned:
Comments on the companies' debt management...
 Refer to the January 29, 2016, income statement and balance sheet of Lowe's Companies Inc. below. LOWE'S COMPANIES INC. Income Statement (In millions) For Fiscal Year Ended January 29, 2016 Net sales.............................................. Cost of sales.................................. ... Gross margin ....................................... Selling, general and administrative Depreciation.. tion......................................... Interest-net........................................ Total expenses... Pretax earnings Income tax provision ... Net earnings $59,074 38,504 20,570 14,115 1,484 552 16.151 4,419 1,873 $ 2,546 Required: Compute the following liquidity, solvency, and coverage ratios for Lowe's Companies. Interpret...
 Wal-Mart’s Liquidity ratios: what is the three-year trend?
Walmart Inc Balance sheet(s) Walmart Inc Income Statement(s) ..2015 ..2014 ..2013 9,135,000 6,778,000 45,141,000 2,224,000 63,278,000 116,655,000 18,102,000 5,671,000 203,706,000 7,281,000 6,677,000 44,858,000 2,369,000 61,185,000 117,907,000 19,510,000 6,149,000 204,751,000 7,781,000 6,768,000 43,803,000 1,588,000 59,940,000 116,681,000 20,497,000 5,987,000 203,105,000 Period Ending Assets Current Assets Cash And Cash Equivalents Accounts Receivable Inventory Other Current Assets Total Current Assets Fixed Assets Goodwill Other Assets Total Assets Liabilities Current Liabilities Accounts Payable Current Portion Long Term...
Wal-Mart’s Liquidity ratios: what is the three-year trend?
Walmart Inc Balance sheet(s) Walmart Inc Income Statement(s) ..2015 ..2014 ..2013 9,135,000 6,778,000 45,141,000 2,224,000 63,278,000 116,655,000 18,102,000 5,671,000 203,706,000 7,281,000 6,677,000 44,858,000 2,369,000 61,185,000 117,907,000 19,510,000 6,149,000 204,751,000 7,781,000 6,768,000 43,803,000 1,588,000 59,940,000 116,681,000 20,497,000 5,987,000 203,105,000 Period Ending Assets Current Assets Cash And Cash Equivalents Accounts Receivable Inventory Other Current Assets Total Current Assets Fixed Assets Goodwill Other Assets Total Assets Liabilities Current Liabilities Accounts Payable Current Portion Long Term...
 Using the following information:
Calculate the following ratios for Urban Outfitters for
both 2016 and
2017 (show calculations):
a. Gross profit margin
b. Operating profit margin
c. Net profit margin
d. Times interest earned coverage
e. Return on shareholders’ equity
f. Return on assets
g. Debt-to-equity ratio
h. Days of inventory
i. Inventory turnover ratio
j. Average collection period
Consolidated Income Statements for Urban ters, Inc. 2016 2017 $3.545.794 $3,445,134 Net sales (total revenue) 2,301,181 2,243,232 Cost of sales 906,086...
Using the following information:
Calculate the following ratios for Urban Outfitters for
both 2016 and
2017 (show calculations):
a. Gross profit margin
b. Operating profit margin
c. Net profit margin
d. Times interest earned coverage
e. Return on shareholders’ equity
f. Return on assets
g. Debt-to-equity ratio
h. Days of inventory
i. Inventory turnover ratio
j. Average collection period
Consolidated Income Statements for Urban ters, Inc. 2016 2017 $3.545.794 $3,445,134 Net sales (total revenue) 2,301,181 2,243,232 Cost of sales 906,086...
 Compute and Interpret Liquidity, Solvency and Coverage Ratios Balance sheets and income statements for Lockheed Martin Corporation follow. Refer to these financial statements to answer the requirements. Consolidated Statements of Earnings Year Ended December 31 (In millions) 2016 2015 Net sales Products $ 40,365 $ 34,868 Services 6,883 5,668 Total net sales 47,248 40,536 Cost of sales Products (36,616) (31,091) Services (6,040) (4,824) Severance and other charges (80) (82) Other unallocated costs 550 (47) Total cost of sales (42,186) (36,044)...
 QUESTION 3 From following financial statements, calculate following ratios and analyse the current year and previous year performance a) Current ratio. b) Days sales outstanding (DSO). (Sales 2017 RM500m & Sales 2018 RM600m) c) Inventory turnover ratio d) Total debt to assets e) Return on assets (ROA) (Net income 2017 RM42m &Net income 2018 RM58m) Moon Inc. Balance Sheet (RM millions) as at December 31, 2015 and 2016 2015 21 51 2016 20 84 Cash Accounts receivable Inventory Prepaid expenses...
Most questions answered within 3 hours.
-
The factory method and the abstract factory pattern use
different object oriented
mechanisms are used to...
asked 34 minutes ago -
Given the data below for the monthly sales data at each branch in
your region for...
asked 1 hour ago -
Blossom Company owns 10000 of the 50000 outstanding shares of
Taylor, Inc. common stock. During 2018,...
asked 2 hours ago -
Calculate the following: ***SHOW ALL WORK!!!! Or
NO CREDIT*** Circle your answers. 8pts
each
In the...
asked 4 hours ago -
Bank Z is currently advertising interest rates on its checking
account. They claim to pay an...
asked 3 hours ago -
List two ways of transformation on the response variable that
can be used to deal with...
asked 4 hours ago -
If a 2000 ohm resistor has a -3.90 mA current going through it.
What is the...
asked 4 hours ago -
Please comment on the sentences.
Some types of jobs require more training than others. Some
companies...
asked 5 hours ago -
The )G01 for the hydrolysis of phosphorarginine
reaction depicted below is –32 kJ mol-1.
Phosphoarginine ...
asked 6 hours ago -
Cross a heterozygous blue-eyed goat with a homozygous brown-eyed
goat. Be sure to indicate which kids...
asked 7 hours ago -
Use the following information to answer the next two
questions.
Please refer to question 9-90. A...
asked 7 hours ago -
A solution containing 0.050 g of an unknown electrolyte in 2.50
g of cyclohexane was found...
asked 7 hours ago