


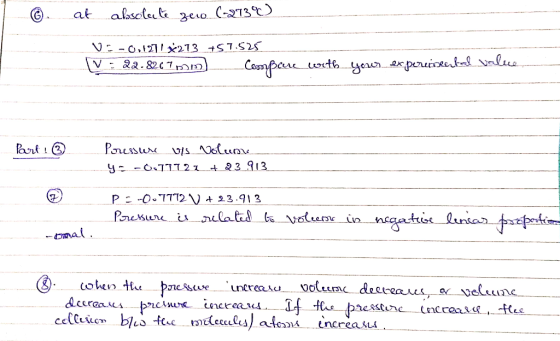
5. Explain the term "absolute zero," and describe why it is not possible to fully investigate this concept in lab. 6. Using your graph, determine the value of absolute zero in °C. How accurate is your experimental value compared to the accepted value? How does this value compare to your graph from Part 1? Show your work. Part 3: Prepare a graph of pressure versus volume (mL). Be sure to follow all good graphing conventions provided in your lab manual (see Graphing Exercise). What is the relationship between gas pressure and volume? 7. the votdme inreases. 8. Explain this relationship in terms of molecular collisions.
Pressure vs. Temp (celcius)- 120 33652%2A85- 100 b". 80 60 40 20 1742 12 223242 5262 72829 Temperature Linear (Seriesı) e Series1 Series2 n
volume (mm) vs. temp(celcius) 65 64 63 E 62 y-0.1271x+57.525O 61 60 59 58 57 10 20 30 40 50 60 temperature(celclus)
pressure vs. volume (mL) 20 18 16 14 12 10 y 0.7772x+ 23.913 'O 0 10 15 20 25 30 Volume (mL) Series1 Series2.Linear (Series1) .Linear (Seriesi)
Homework Answers

Add Answer to:
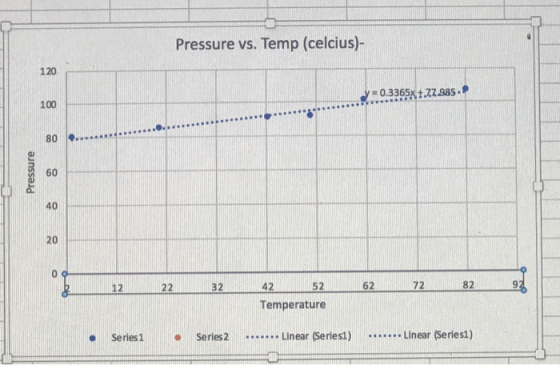
graph 1, 2, and 3 are listed below in order for information. help with answering post lab about graph relationships. Part 1 . Prepare a graph of pressure versus temperature ( C). Be sure to f...
Find P air and V air .. Water vapor accounts for part of the gas volume...
 Find P air and V air ..
Water vapor accounts for part of the gas volume and S8 lle volum u sued must be corrected for the water vapor present. The vapor pressure of the water depends on temperature and the vapor pressure of water (PH,o) at different temperatures can be found in Table 1. If a Ph,o value at a particular temperature is not usted in the table, then it has to be found through the interpolation method from...
Find P air and V air ..
Water vapor accounts for part of the gas volume and S8 lle volum u sued must be corrected for the water vapor present. The vapor pressure of the water depends on temperature and the vapor pressure of water (PH,o) at different temperatures can be found in Table 1. If a Ph,o value at a particular temperature is not usted in the table, then it has to be found through the interpolation method from...
plz help asap Excel Spreadsheet: Part A: Use Excel to generate a spreadsheet with the following information. Co...
 plz help asap
Excel Spreadsheet: Part A: Use Excel to generate a spreadsheet with the following information. Column A Enter the measured masses of sodium carbonate from data page #1 в Using stoichiometry, calculate the theoretical number of moles of CO2 that can be produced from each reactant entry. C Using the ideal gas law, measured volume, and temperature, calculate the theoretical pressure of CO2(g) that can be produced from the theoretical moles of CO2(8) D Actual measured pressures of...
plz help asap
Excel Spreadsheet: Part A: Use Excel to generate a spreadsheet with the following information. Column A Enter the measured masses of sodium carbonate from data page #1 в Using stoichiometry, calculate the theoretical number of moles of CO2 that can be produced from each reactant entry. C Using the ideal gas law, measured volume, and temperature, calculate the theoretical pressure of CO2(g) that can be produced from the theoretical moles of CO2(8) D Actual measured pressures of...
I need help on how to find the atmospheric pressure from the scatter plot and trend...
 I need help on how to find the atmospheric pressure from the
scatter plot and trend line I made with the results from my Boyle's
Law lab. I don't know if my scatter plot is correct. I need the
atmospheric pressure in order to fill in Table 5 and answer some
questions.
24. Use the data in Data Table 1 and Data Table 3 to create a
scatter-plot graph of 1/Average Volume vs. Pressure; with
“1/Average Volume (mL-1)” on the...
I need help on how to find the atmospheric pressure from the
scatter plot and trend line I made with the results from my Boyle's
Law lab. I don't know if my scatter plot is correct. I need the
atmospheric pressure in order to fill in Table 5 and answer some
questions.
24. Use the data in Data Table 1 and Data Table 3 to create a
scatter-plot graph of 1/Average Volume vs. Pressure; with
“1/Average Volume (mL-1)” on the...
2ee do heete renouth hecel. to obtein Don't Cs CAS remax let graclolertee C abOu Lecore...
 2ee do heete renouth hecel. to obtein Don't Cs CAS remax let graclolertee C abOu Lecore kmp ris lous knap oin ane vol Barome tris Pressore (u Ha) t8 s Tenpor watC oe AR (me) volome jo.00 mL loo leS. 16 5S.Le 50.6 4.0 le.is 5.80 5.45 caleoltrons Twakr 1/Twak.( Pair (u tnHa Proateam e Peoatatu Calculations: (0.5 pt for each block) Twater (K) 1/Twater (K) Pair (mm Hg) Pwater (mm Hg) Pwater (atm) In Pwater 92 We were unable...
Need help with the first picture. Data provided in pictures #2 & #3 Determining the Activation...
 Need help with the first picture. Data provided in pictures #2
& #3
Determining the Activation Energy and Collision Frequency Factor for Reaction 1 Part 1. Transfer the reaction rate for runs 9.12 from Data Sheet 3. Then calculate the rate constant (R) at each temperature based on the reaction orders determined in parts and Record the results in Tables * = 18,0 ->15.0416"5,0216" Equation 6 ->25 10 2. Calculate the natural logarithm of the rate constant. In ) and...
Need help with the first picture. Data provided in pictures #2
& #3
Determining the Activation Energy and Collision Frequency Factor for Reaction 1 Part 1. Transfer the reaction rate for runs 9.12 from Data Sheet 3. Then calculate the rate constant (R) at each temperature based on the reaction orders determined in parts and Record the results in Tables * = 18,0 ->15.0416"5,0216" Equation 6 ->25 10 2. Calculate the natural logarithm of the rate constant. In ) and...
For the preparation and standardization of NaOH with KHP im supposed to boil water for 1hr and 30 min to remove CO2
For the preparation and standardization of NaOH with KHP im supposed to boil water for 1hr and 30 min to remove CO2....the problem is that if I don't boil it for that long and (30 min) b/c of not enough time but I put the water I boiled for 1/2 hr aproximately into a NaOH bottle with a CO2 absorber and stored it there for a few days. I would assume that I would have to boil the water again...but...
 Find P air and V air ..
Water vapor accounts for part of the gas volume and S8 lle volum u sued must be corrected for the water vapor present. The vapor pressure of the water depends on temperature and the vapor pressure of water (PH,o) at different temperatures can be found in Table 1. If a Ph,o value at a particular temperature is not usted in the table, then it has to be found through the interpolation method from...
Find P air and V air ..
Water vapor accounts for part of the gas volume and S8 lle volum u sued must be corrected for the water vapor present. The vapor pressure of the water depends on temperature and the vapor pressure of water (PH,o) at different temperatures can be found in Table 1. If a Ph,o value at a particular temperature is not usted in the table, then it has to be found through the interpolation method from...
 plz help asap
Excel Spreadsheet: Part A: Use Excel to generate a spreadsheet with the following information. Column A Enter the measured masses of sodium carbonate from data page #1 в Using stoichiometry, calculate the theoretical number of moles of CO2 that can be produced from each reactant entry. C Using the ideal gas law, measured volume, and temperature, calculate the theoretical pressure of CO2(g) that can be produced from the theoretical moles of CO2(8) D Actual measured pressures of...
plz help asap
Excel Spreadsheet: Part A: Use Excel to generate a spreadsheet with the following information. Column A Enter the measured masses of sodium carbonate from data page #1 в Using stoichiometry, calculate the theoretical number of moles of CO2 that can be produced from each reactant entry. C Using the ideal gas law, measured volume, and temperature, calculate the theoretical pressure of CO2(g) that can be produced from the theoretical moles of CO2(8) D Actual measured pressures of...
 I need help on how to find the atmospheric pressure from the
scatter plot and trend line I made with the results from my Boyle's
Law lab. I don't know if my scatter plot is correct. I need the
atmospheric pressure in order to fill in Table 5 and answer some
questions.
24. Use the data in Data Table 1 and Data Table 3 to create a
scatter-plot graph of 1/Average Volume vs. Pressure; with
“1/Average Volume (mL-1)” on the...
I need help on how to find the atmospheric pressure from the
scatter plot and trend line I made with the results from my Boyle's
Law lab. I don't know if my scatter plot is correct. I need the
atmospheric pressure in order to fill in Table 5 and answer some
questions.
24. Use the data in Data Table 1 and Data Table 3 to create a
scatter-plot graph of 1/Average Volume vs. Pressure; with
“1/Average Volume (mL-1)” on the...
 2ee do heete renouth hecel. to obtein Don't Cs CAS remax let graclolertee C abOu Lecore kmp ris lous knap oin ane vol Barome tris Pressore (u Ha) t8 s Tenpor watC oe AR (me) volome jo.00 mL loo leS. 16 5S.Le 50.6 4.0 le.is 5.80 5.45 caleoltrons Twakr 1/Twak.( Pair (u tnHa Proateam e Peoatatu Calculations: (0.5 pt for each block) Twater (K) 1/Twater (K) Pair (mm Hg) Pwater (mm Hg) Pwater (atm) In Pwater 92 We were unable...
 Need help with the first picture. Data provided in pictures #2
& #3
Determining the Activation Energy and Collision Frequency Factor for Reaction 1 Part 1. Transfer the reaction rate for runs 9.12 from Data Sheet 3. Then calculate the rate constant (R) at each temperature based on the reaction orders determined in parts and Record the results in Tables * = 18,0 ->15.0416"5,0216" Equation 6 ->25 10 2. Calculate the natural logarithm of the rate constant. In ) and...
Need help with the first picture. Data provided in pictures #2
& #3
Determining the Activation Energy and Collision Frequency Factor for Reaction 1 Part 1. Transfer the reaction rate for runs 9.12 from Data Sheet 3. Then calculate the rate constant (R) at each temperature based on the reaction orders determined in parts and Record the results in Tables * = 18,0 ->15.0416"5,0216" Equation 6 ->25 10 2. Calculate the natural logarithm of the rate constant. In ) and...
Most questions answered within 3 hours.
-
(63
#14)
which of the following statments best describes how chamging
the concentration of the substances...
asked 1 hour ago -
In the following reaction, which element is undergoing
oxidation: Na2SO3 + N2O --> N2 + Na2SO4...
asked 2 hours ago -
Which of the following pairs of ions have the same electron
configuration?
I: Br− and Se2−...
asked 4 hours ago -
The Foremost Composite Materials Company is planning a two-day
sales conference for October 19-20. The conference...
asked 5 hours ago -
3) Illustrate the observed pattern of relatedness of organisms
versus adaptations to specific conditions. This means...
asked 5 hours ago -
In winter a lake has a 0.35 m thick ice layer over 1.10 m of
water....
asked 6 hours ago -
Assuming the following has been encrypted with a Vigenere cipher
below, use the method(s) and assumptions...
asked 6 hours ago -
How would I use switch statements to write a program that will
take an input of...
asked 6 hours ago -
Imagine a reaction in which methane gas combusts at a constant
pressure of 1 atm and...
asked 6 hours ago -
Two parallel wires (each 12 m in length) are separated by a
distance of 0.065 m...
asked 6 hours ago -
Suppose there were three masses at the corner of uniform
equilateral triangle. The masses are m1...
asked 6 hours ago -
Situation: A building that is 618 m above the ground floor. How
many times would a...
asked 7 hours ago