


4. Unwed Women Having Children The Pew Research Group asked the following question of individuals who earned in excess of $100,000 per year and those who earned less than $100,000 per year:"Do you believe that it is morally wrong in women to have children? Of the 1205 individuals who earned in excess of $100,000 who earned less than $100,000 per year, 695 said yes. Construct a 95% confidence interval to determine if there is a difference in the proportion of individuals who believe it is morally wrong for unwed women to have children. for unwed per year, 710 said yes:of the 1310 individuals
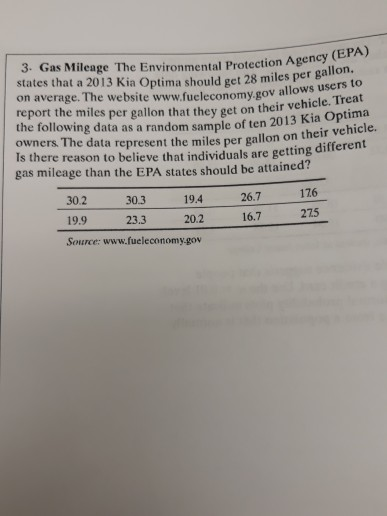
3. Gas Mileage The Environmental Protection Agency (EPA) states that a 2013 Kia Optima should get 28 miles per ga report the miles per gallon that they get on their vehicle. Treat s there reason to believe that individuals are getting different 19.4 on average. The website www.fueleconomy.gov allows users to 13 Kia Optima the following data as a random sample of ten 20 owners The data represent the miles per gallon on their vehicle. gas mileage than the EPA states should be attained? 176 26.7 30.2 19.9 Source: www.fueleconomy.gov 30.3 275 16.7 20.2 23.3
2. Ca on fast-food when they use a credit card? The following data represent a random sample of credit-card and cash purchases sh or Credit? Do people tend to spend more money Credit 23.89 13.89 15.54 10.35 12.76 18.32 20.67 18.36 19.16 Cash 6.78 9.21 6.26 18.98 10.76 21.76 Source: Brian Ortiz, student at Joliet Junior College 11.36 8.90 15.64 13.78 Test whether the sample evidence suggests that people spend more when using a credit card. Use the 0.01 level of significance. Note: Normal probability plots indicate that each sample could come from a population that is normally distributed
7. Wet Suits Do wet suits allow a swimmer to swim faster? Researchers measured the speed (in meters per second) of swimmers both with and without a wetsuit. The results of the study are shown in the table. Conduct the appropriate test to determine whether the data suggest that wet suits allow a swimmer to swim faster. Use an -0.05 level af significance Swimmer 1 Without 1.49 137 1.35 127 1.12 164 With 157 1.47 1.42 1.35 1.22 1.75 7 8 910 11 12 Swimmer Without1.59 1.52 1.50 145 1.44 1.41 With 1.64 1.57 1.56 1.53 1.49 1.51 Source: Data from de Lucas R.D, Balildan, P. Neiva.C.M.,Greco, с.С. & Denadai, B.S (2000). The effects of wet suits on physiological and biomechanical indices during swimming. Journal of Science and Medicine in Sport 3 (1):1-8
S. Profile of Smokers The following data represent the smoking status from a random sample of 1054 U.S, residents 18 years or older by level of education. Smoking Status Number of Years of Education 512 12 13-15 16 or more Source: National Health Interview Survey Current 178 137 Former Never 208 143 69 25 51 34 Test whether smoking status and level of education are independent at the α 0.05 level of significance.
For the following problem assume that the prerequisites have been met. Use and state the 6 steps to hypothesis testing: 1 -state the null and alternative hypotheses; 2 -state the level of significance; 3 - state the calculator command and the values entered; 4 state the value of the test statistic and p-value; 5 - state whether to reject or fail to reject the null hypothesis; 6-state the αnclusion in the context of the problem to test the stated claim. 1. Always Wear a Helmet The National Highway Traffic Safety Administration publishes reports about motorcycle fatalities and helmet use. The distribution shows the proportion of fatalities by location of injury for motorcycle accidents Location Multiple of injury Locations Head Neck Thorax Lumbar'Spine Proportion 0.57 Abdomen 0.31 0.03 0.06 0.03 The following data show the location of injury and number of fatalities for 2068 riders not wearing a helmet. Abdomen Location Multiple of injury Locations Head Neck Thorax Lumbar/Spine Number 1036 864 38 47 (a) Does the distribution of fatal injuries for riders not wearing a helmet follow the distribution for all riders? Use the α-0.05 level of significance. (b) Compare the observed and expected counts for each category. What does this information tell you?
Homework Answers
6)
We want to test if the data comes from a uniform distribution. If the data follows a uniform distribution, then each day will have the same frequency of accidents.
We have 7 days, and a total of 300 accidents in this week, so 300/7=42.86 accidents per day.


Since the hypothesis test is rejected, we conclude that the data does not follow a uniform distribution.
Add Answer to:
6. Pedestrian Deaths A researcher wanted to determinse whether pedestrian deaths were uniformly distributed over the days of the week. She randomly selected 300 pedestrian...
Goodness of Fit Test 5. Aresearcher wanted to determine bicycle deaths were uniformly distributed over the...
 Goodness of Fit Test 5. Aresearcher wanted to determine bicycle deaths were uniformly distributed over the days of the week. She randomly selected 200 deaths by bicycles, recorded the days they happened with the following data Monday Fuesday Wednesday Thursday Friday Saturday 16 35 16 28 34 30 s there evidence to believe that bicycle deaths occur with equal frequency with respect to day of the week at a 0.05 level of significance
A researcher wanted to determine whether certain accidents were uniformly distributed over the days of the...
 A researcher wanted to determine whether certain accidents were uniformly distributed over the days of the week. The data show the day of the week for n = 304 randomly selected accidents. Is there reason to believe that the accident occurs with equal frequency with respect to the day of the week at the α 0.05 level of significance? lB Click the icon to view the table Distribution of accidents H+: More accidents occur earlier in the week than later...
A researcher wanted to determine whether certain accidents were uniformly distributed over the days of the...
 A researcher wanted to determine whether certain accidents were uniformly distributed over the days of the week. The data show the day of the week or n = 304 randomly selected accidents. Is there reason to believe that the accident occurs with equal frequency with respect to the day of the week at the α = 0.05 level of significance? B Click the icon to view the table Distribution of accidents : More accidents occur earlier in the week than...
accidents were uniformly distributed over the days of the week. The data n 317 randomly selected...
 accidents were uniformly distributed over the days of the week. The data n 317 randomly selected accidents. Is there reason to believe that the accident occurs with un 1. A researcher wanted to determine whether certain for equal frequenay with respect to the day of the week at the a 0.05 level of significance? Click the icon to view the table Let p, the proportion of accidents on day i. where i 1 for Sunday, 2 for Monday, etc. What...
A researcher wanted to determine whether certain extent were uniformly distributed over the days of the...
 A
researcher wanted to determine whether certain extent were
uniformly distributed over the days of the week the data show the
day of the week for n=306 randomly selected accidents is there a
reason to believe that the accident occurs with equal frequency
with respect to the day of the week at the a=.05 level of
significance?
Day of the Week Frequency Accidents Sunday Monday Tuesday Wednesday Thursday Friday Saturday 41 41 27 45 50 62 40 Letp:= the proportion...
A
researcher wanted to determine whether certain extent were
uniformly distributed over the days of the week the data show the
day of the week for n=306 randomly selected accidents is there a
reason to believe that the accident occurs with equal frequency
with respect to the day of the week at the a=.05 level of
significance?
Day of the Week Frequency Accidents Sunday Monday Tuesday Wednesday Thursday Friday Saturday 41 41 27 45 50 62 40 Letp:= the proportion...
anufacturer of colored candies states that 13% of the candies in a bag should be brown,...
 anufacturer of colored candies states that 13% of the candies in a bag should be brown, 14% yellow 13% red, 24% blue, 20% orange, and 16% green. A student random y selected a bag of colored candies. He counted the numbe candies of each color and obtained the results shown in the table. Test whether the bag of colored candies follows the distribution stated above at the α = 0.05 level of significance. EEB Click the icon to view the...
This Quiz: 6 pts possit Question Help A researcher wanted to determine whether certain accidents were...
 This Quiz: 6 pts possit Question Help A researcher wanted to determine whether certain accidents were uniformly distributed over the days of the week. The data show the day of the week for n 300 randomly selected accidents. Is there reason to believe that the accident occurs with equal frequency with respect to the day of the week at the a=0.05 level of significance? B Click the icon to view the table. Let the proportion of accidents on day I,...
 Goodness of Fit Test 5. Aresearcher wanted to determine bicycle deaths were uniformly distributed over the days of the week. She randomly selected 200 deaths by bicycles, recorded the days they happened with the following data Monday Fuesday Wednesday Thursday Friday Saturday 16 35 16 28 34 30 s there evidence to believe that bicycle deaths occur with equal frequency with respect to day of the week at a 0.05 level of significance
 A researcher wanted to determine whether certain accidents were uniformly distributed over the days of the week. The data show the day of the week for n = 304 randomly selected accidents. Is there reason to believe that the accident occurs with equal frequency with respect to the day of the week at the α 0.05 level of significance? lB Click the icon to view the table Distribution of accidents H+: More accidents occur earlier in the week than later...
 A researcher wanted to determine whether certain accidents were uniformly distributed over the days of the week. The data show the day of the week or n = 304 randomly selected accidents. Is there reason to believe that the accident occurs with equal frequency with respect to the day of the week at the α = 0.05 level of significance? B Click the icon to view the table Distribution of accidents : More accidents occur earlier in the week than...
 accidents were uniformly distributed over the days of the week. The data n 317 randomly selected accidents. Is there reason to believe that the accident occurs with un 1. A researcher wanted to determine whether certain for equal frequenay with respect to the day of the week at the a 0.05 level of significance? Click the icon to view the table Let p, the proportion of accidents on day i. where i 1 for Sunday, 2 for Monday, etc. What...
 A
researcher wanted to determine whether certain extent were
uniformly distributed over the days of the week the data show the
day of the week for n=306 randomly selected accidents is there a
reason to believe that the accident occurs with equal frequency
with respect to the day of the week at the a=.05 level of
significance?
Day of the Week Frequency Accidents Sunday Monday Tuesday Wednesday Thursday Friday Saturday 41 41 27 45 50 62 40 Letp:= the proportion...
A
researcher wanted to determine whether certain extent were
uniformly distributed over the days of the week the data show the
day of the week for n=306 randomly selected accidents is there a
reason to believe that the accident occurs with equal frequency
with respect to the day of the week at the a=.05 level of
significance?
Day of the Week Frequency Accidents Sunday Monday Tuesday Wednesday Thursday Friday Saturday 41 41 27 45 50 62 40 Letp:= the proportion...
 anufacturer of colored candies states that 13% of the candies in a bag should be brown, 14% yellow 13% red, 24% blue, 20% orange, and 16% green. A student random y selected a bag of colored candies. He counted the numbe candies of each color and obtained the results shown in the table. Test whether the bag of colored candies follows the distribution stated above at the α = 0.05 level of significance. EEB Click the icon to view the...
 This Quiz: 6 pts possit Question Help A researcher wanted to determine whether certain accidents were uniformly distributed over the days of the week. The data show the day of the week for n 300 randomly selected accidents. Is there reason to believe that the accident occurs with equal frequency with respect to the day of the week at the a=0.05 level of significance? B Click the icon to view the table. Let the proportion of accidents on day I,...
Most questions answered within 3 hours.
-
hello there ,, can anyone give the solution of this
Assuming a graph is represented as...
asked 15 minutes ago -
For Biswell Company, variable costs are 70% of sales and fixed
costs are $188,400. Calculate the...
asked 21 minutes ago -
What is the vapor pressure of the solution if 18.0 g of water is
dissolved in...
asked 33 minutes ago -
Somatic mosaics result from:
a) chromosomes that do not replicate during S phase
b) a byproduct...
asked 30 minutes ago -
Two forces of magnitudes 9.0 N and 12.0 N act on an object.
What is the...
asked 39 minutes ago -
Given the Boolean function F=
xy'z+x'y'z+xyz
a.List the truth table of the function.
b.Draw the logic...
asked 1 hour ago -
BACKGROUND
Movie Review sites collect reviews and will often provide some
sort of average review to...
asked 51 minutes ago -
A union employee does not fall under the employment-at-will
doctrine. True or False
asked 54 minutes ago -
Determine whether each of the following statements is
TRUE or FALSE, and write a short explanation...
asked 1 hour ago -
Please NEED ASAP
- How does Arrowsmith reveal the increasing commercialism of
medical practice and research?...
asked 1 hour ago -
The category name and a count of the number of products within
each category. The listing...
asked 58 minutes ago -
Write a simple telephone directory program in C++ that looks up
phone numbers in a file...
asked 1 hour ago