MATLAB HELP
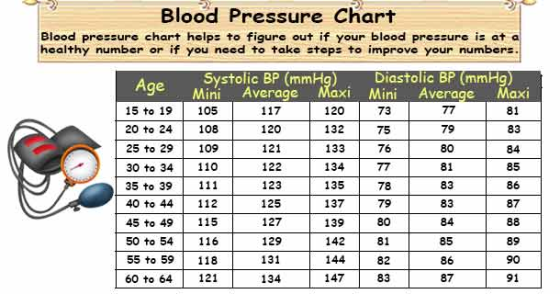
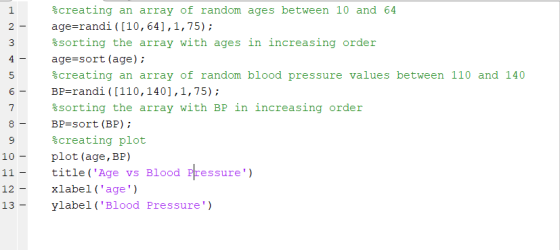
I need help generating random age(x) and average systolic blood pressure(y) values or data similar to the table below in matlab. i need 75 reading or data points for both and plot of age(x) against blood pressure(y). The age should be a number e.g 1, 22, 13,... and not 15 to 90, 20-24 like the chart shows for easy plotting. also the age and blood pressure show be in increasing order like the table below. Please attach matlab code of how to generate this data points and plot. Thanks in advance
Homework Answers

Add Answer to:
MATLAB HELP I need help generating random age(x) and average systolic blood pressure(y) values or data similar to the table below in matlab. i need 75 reading or data points for both and plot of age(x...
I need help on calculating a current overall average for this data in MatLab. I need...
I need help on calculating a current overall average for this data in MatLab. I need to make another vector for the data where each position is a current average. I've looked around online to try and get an idea of what to do and I saw the things about there being a moving average function or using filter. But we haven't talked about those in my class so I can't use them. I think a for loop could do...
You have two groups of apples (data below). You want to see if there is a...
You have two groups of apples (data below). You want to see if there is a statistical differnce between the two groups. Run descriptives and a two tailed, two sample assuming equal variance t-test. Here's your data: Weight of Apples in Grams Apple ID Farm A Farm B 1 131 151 2 147 159 3 134 162 4 134 158 5 136 159 6 137 160 7 140 150 8 134 160 9 136 160 10 133 160 11 134...
Determination of Molecular Structure from molecular formula, mass, IR, and Mass Spec data. Molecular Weight: 134.22...
 Determination of Molecular Structure from molecular
formula, mass, IR, and Mass Spec data.
Molecular Weight: 134.22
Molecular Formula: C10H14
I need help finding the structure.
IR Data (3300-2650 Range):
*No peaks between 2650 and 2100*
IR Data (2100-600 Range):
MS Data (Two different views):
MS Peaks Labeled:
Transmittance 60 80 100 3250 43088.1; 95. +3060.1; 93.5 -3022.9; 93.9 2961.4; 64.843 3200 3150 3100 3050 3000 Wavenumber (cm-1) 2950 TTTTTTTTTTTTTIIIIIITTTTTTTTTTTTTTTTTTTTTTTTTTT 29002850 2800 2750 2700 2650 2903.6; 86.663 2866.3; 86.398 20... 40...
Determination of Molecular Structure from molecular
formula, mass, IR, and Mass Spec data.
Molecular Weight: 134.22
Molecular Formula: C10H14
I need help finding the structure.
IR Data (3300-2650 Range):
*No peaks between 2650 and 2100*
IR Data (2100-600 Range):
MS Data (Two different views):
MS Peaks Labeled:
Transmittance 60 80 100 3250 43088.1; 95. +3060.1; 93.5 -3022.9; 93.9 2961.4; 64.843 3200 3150 3100 3050 3000 Wavenumber (cm-1) 2950 TTTTTTTTTTTTTIIIIIITTTTTTTTTTTTTTTTTTTTTTTTTTT 29002850 2800 2750 2700 2650 2903.6; 86.663 2866.3; 86.398 20... 40...
From these data you need to determine the number of individuals that survived to each age,...
 From these data you need
to determine the number of individuals that survived to each age,
starting with the original 91 at age 0.
OBSERVATIONS FROM THE FIELD The following data are collected from the field from an unharvested population of parrots. Listed are longevity data from a cohort of 91 females and fecundity data from a sample of 25 females. The data are only from females because reproductive output in males is difficult to measure. We will assume that...
From these data you need
to determine the number of individuals that survived to each age,
starting with the original 91 at age 0.
OBSERVATIONS FROM THE FIELD The following data are collected from the field from an unharvested population of parrots. Listed are longevity data from a cohort of 91 females and fecundity data from a sample of 25 females. The data are only from females because reproductive output in males is difficult to measure. We will assume that...
please peovide coding in R: with a data of 13 variables and 200 observations Using the...
 please peovide coding in R:
with a data of 13 variables and 200 observations
Using the variable CLASS, test at 5% significance level to
test the claim that the
proportions of Freshmen, Sophomores, Juniors, and Seniors are
the same.
2. Repeat part (a) for the variable COLLEGE.
RLM ENGLISH MATH COMP 21 16 25 839SSESSOR 8 F 17 F N H ABCD 1 SEX HSP GPA AGE CREDITS CLASS COLLEGE MAJOR RESIDENCY TYPE 2 Transfer Blochm Resident F 75 2.39...
please peovide coding in R:
with a data of 13 variables and 200 observations
Using the variable CLASS, test at 5% significance level to
test the claim that the
proportions of Freshmen, Sophomores, Juniors, and Seniors are
the same.
2. Repeat part (a) for the variable COLLEGE.
RLM ENGLISH MATH COMP 21 16 25 839SSESSOR 8 F 17 F N H ABCD 1 SEX HSP GPA AGE CREDITS CLASS COLLEGE MAJOR RESIDENCY TYPE 2 Transfer Blochm Resident F 75 2.39...
2. Using the data set of the Health Exam Results, conduct the following analysis between the variables of weight (WT) and Body Mass Index (BMI). Number the data set from 1 to 40, and select the...
 2. Using the data set of the Health Exam Results, conduct the following analysis between the variables of weight (WT) and Body Mass Index (BMI). Number the data set from 1 to 40, and select the following individuals: . Set 1 (Malo): 1, 5, 10, 13, 15, 18, 19, 24, 29, 31, 32, 33 .Set 2 (Fomalo): 4, 9, 15, 16, 17, 22, 23, 29, 33, 37, 38, 40 Draw a scatter diagram of the sample of 12 data set...
data: (copy and paste in excel to view columns in alignment) Sample Repair Time (days) 1 ...
 data: (copy and paste in excel to view columns in alignment)
Sample Repair Time (days)
1 12
2 17
3 9
4 16
5 10
6 18
7 12
8 14
9 15
10 14
11 14
12 8
13 11
14 10
15 8
16 8
17 14
18 12
19 14
20 13
21 12
22 15
23 15
24 10
25 24
26 17
27 13
28 15
29 13
30 15
31 36
32 40
33 ...
data: (copy and paste in excel to view columns in alignment)
Sample Repair Time (days)
1 12
2 17
3 9
4 16
5 10
6 18
7 12
8 14
9 15
10 14
11 14
12 8
13 11
14 10
15 8
16 8
17 14
18 12
19 14
20 13
21 12
22 15
23 15
24 10
25 24
26 17
27 13
28 15
29 13
30 15
31 36
32 40
33 ...
Use the Tornadoes Data and your statistical expertise to answer the questions: Is it reasonable to claim that the averag...
Use the Tornadoes Data and your statistical expertise to answer the questions: Is it reasonable to claim that the average number of observed tornadoes per year is different from the average number of tornado related deaths per year? 5. What test/procedure did you perform? a. One-sided t-test b. Two-sided t-test c. Regression d. Confidence interval 6. What is the P-Value/margin of error? a. 0.007034504 b. 0.34922 c. 4.07497E-24 d. 2.03749E-24 e. None of these 7. Statistical Interpretation a. Since P-value...
Is it reasonable to claim that the average number of observed tornadoes per year is different...
Is it reasonable to claim that the average number of observed tornadoes per year is different from the average number of tornado related deaths per year? 5. What test/procedure did you perform? a. One-sided t-test b. Two-sided t-test c. Regression d. Confidence interval 6. What is the P-Value/margin of error? a. 0.007034504 b. 0.34922 c. 4.07497E-24 d. 2.03749E-24 e. None of these 7. Statistical Interpretation a. Since P-value is very small we are confident that the number of tornadoes will...
I need help understanding what I need to do to complete this spreadsheet (steps on how...
 I need help understanding what I need to do to complete this
spreadsheet (steps on how to start it) in Excel, thank you!
Spreadsheet Assignment 2 Riesk and Return Historical Data NSTRUCTIONS listorical price data are obtained for Stocks X, Y, Z. To erform the required analysis, as demonstrated in the preadsheet modeling video, first calculate the rates f return for each stock. Then use the RETURNS data not price) to perform the required analysis. Please be ure to watch...
I need help understanding what I need to do to complete this
spreadsheet (steps on how to start it) in Excel, thank you!
Spreadsheet Assignment 2 Riesk and Return Historical Data NSTRUCTIONS listorical price data are obtained for Stocks X, Y, Z. To erform the required analysis, as demonstrated in the preadsheet modeling video, first calculate the rates f return for each stock. Then use the RETURNS data not price) to perform the required analysis. Please be ure to watch...
 Determination of Molecular Structure from molecular
formula, mass, IR, and Mass Spec data.
Molecular Weight: 134.22
Molecular Formula: C10H14
I need help finding the structure.
IR Data (3300-2650 Range):
*No peaks between 2650 and 2100*
IR Data (2100-600 Range):
MS Data (Two different views):
MS Peaks Labeled:
Transmittance 60 80 100 3250 43088.1; 95. +3060.1; 93.5 -3022.9; 93.9 2961.4; 64.843 3200 3150 3100 3050 3000 Wavenumber (cm-1) 2950 TTTTTTTTTTTTTIIIIIITTTTTTTTTTTTTTTTTTTTTTTTTTT 29002850 2800 2750 2700 2650 2903.6; 86.663 2866.3; 86.398 20... 40...
Determination of Molecular Structure from molecular
formula, mass, IR, and Mass Spec data.
Molecular Weight: 134.22
Molecular Formula: C10H14
I need help finding the structure.
IR Data (3300-2650 Range):
*No peaks between 2650 and 2100*
IR Data (2100-600 Range):
MS Data (Two different views):
MS Peaks Labeled:
Transmittance 60 80 100 3250 43088.1; 95. +3060.1; 93.5 -3022.9; 93.9 2961.4; 64.843 3200 3150 3100 3050 3000 Wavenumber (cm-1) 2950 TTTTTTTTTTTTTIIIIIITTTTTTTTTTTTTTTTTTTTTTTTTTT 29002850 2800 2750 2700 2650 2903.6; 86.663 2866.3; 86.398 20... 40...
 From these data you need
to determine the number of individuals that survived to each age,
starting with the original 91 at age 0.
OBSERVATIONS FROM THE FIELD The following data are collected from the field from an unharvested population of parrots. Listed are longevity data from a cohort of 91 females and fecundity data from a sample of 25 females. The data are only from females because reproductive output in males is difficult to measure. We will assume that...
From these data you need
to determine the number of individuals that survived to each age,
starting with the original 91 at age 0.
OBSERVATIONS FROM THE FIELD The following data are collected from the field from an unharvested population of parrots. Listed are longevity data from a cohort of 91 females and fecundity data from a sample of 25 females. The data are only from females because reproductive output in males is difficult to measure. We will assume that...
 please peovide coding in R:
with a data of 13 variables and 200 observations
Using the variable CLASS, test at 5% significance level to
test the claim that the
proportions of Freshmen, Sophomores, Juniors, and Seniors are
the same.
2. Repeat part (a) for the variable COLLEGE.
RLM ENGLISH MATH COMP 21 16 25 839SSESSOR 8 F 17 F N H ABCD 1 SEX HSP GPA AGE CREDITS CLASS COLLEGE MAJOR RESIDENCY TYPE 2 Transfer Blochm Resident F 75 2.39...
please peovide coding in R:
with a data of 13 variables and 200 observations
Using the variable CLASS, test at 5% significance level to
test the claim that the
proportions of Freshmen, Sophomores, Juniors, and Seniors are
the same.
2. Repeat part (a) for the variable COLLEGE.
RLM ENGLISH MATH COMP 21 16 25 839SSESSOR 8 F 17 F N H ABCD 1 SEX HSP GPA AGE CREDITS CLASS COLLEGE MAJOR RESIDENCY TYPE 2 Transfer Blochm Resident F 75 2.39...
 2. Using the data set of the Health Exam Results, conduct the following analysis between the variables of weight (WT) and Body Mass Index (BMI). Number the data set from 1 to 40, and select the following individuals: . Set 1 (Malo): 1, 5, 10, 13, 15, 18, 19, 24, 29, 31, 32, 33 .Set 2 (Fomalo): 4, 9, 15, 16, 17, 22, 23, 29, 33, 37, 38, 40 Draw a scatter diagram of the sample of 12 data set...
 data: (copy and paste in excel to view columns in alignment)
Sample Repair Time (days)
1 12
2 17
3 9
4 16
5 10
6 18
7 12
8 14
9 15
10 14
11 14
12 8
13 11
14 10
15 8
16 8
17 14
18 12
19 14
20 13
21 12
22 15
23 15
24 10
25 24
26 17
27 13
28 15
29 13
30 15
31 36
32 40
33 ...
data: (copy and paste in excel to view columns in alignment)
Sample Repair Time (days)
1 12
2 17
3 9
4 16
5 10
6 18
7 12
8 14
9 15
10 14
11 14
12 8
13 11
14 10
15 8
16 8
17 14
18 12
19 14
20 13
21 12
22 15
23 15
24 10
25 24
26 17
27 13
28 15
29 13
30 15
31 36
32 40
33 ...
 I need help understanding what I need to do to complete this
spreadsheet (steps on how to start it) in Excel, thank you!
Spreadsheet Assignment 2 Riesk and Return Historical Data NSTRUCTIONS listorical price data are obtained for Stocks X, Y, Z. To erform the required analysis, as demonstrated in the preadsheet modeling video, first calculate the rates f return for each stock. Then use the RETURNS data not price) to perform the required analysis. Please be ure to watch...
I need help understanding what I need to do to complete this
spreadsheet (steps on how to start it) in Excel, thank you!
Spreadsheet Assignment 2 Riesk and Return Historical Data NSTRUCTIONS listorical price data are obtained for Stocks X, Y, Z. To erform the required analysis, as demonstrated in the preadsheet modeling video, first calculate the rates f return for each stock. Then use the RETURNS data not price) to perform the required analysis. Please be ure to watch...
Most questions answered within 3 hours.
-
How many moles of oxygen would be consumed during the aerobic
oxidation of one mole of...
asked 1 minute from now -
Identify the incorrect statement.
A. An increase in mol does not increase the average force of...
asked 19 seconds ago -
In broadcast authentication, a senderaims to send
oneauthentication code for multiple receivers to verify. Explain
why...
asked 3 seconds ago -
A student studying for a vocabulary test knows the meanings of
16 words from a list...
asked 31 minutes ago -
List the most common organic functional groups that function as
acids or bases. Write an equation...
asked 12 minutes ago -
1) A protein is 435 amino acids long, which of the genes below
COULD NOT code...
asked 15 minutes ago -
What do the phenomena of overshadowing, the CS preexposure
effect, and relative validity of cues have...
asked 43 minutes ago -
Assuming air has a density of 1.17 g/L and .973 atm what is the
average molar...
asked 36 minutes ago -
Developmental Biology! Please answer all the questions
7) Mislocalization of oscar to the side of the...
asked 30 minutes ago -
We have two Earths, one as ours and another that is twice
heavier than that of...
asked 39 minutes ago -
At an annual interest rate of 6%, which would you prefer; three
annual year-end cash flows...
asked 37 minutes ago -
1. (40’) In myStack.cpp, implement the member functions of the
class myStack, which is the class...
asked 38 minutes ago