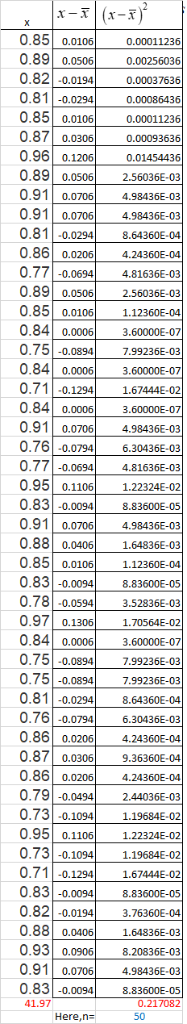
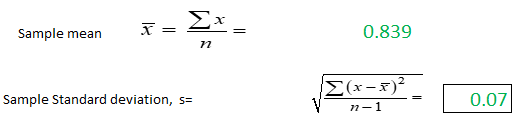
Question Help The following data represent the weights (in grams) of a random sample of 50 candies. 0.85 0.89 0.82 0.81 0.85 0.87 0.96 0.89 0.91 0.91 0.81 0.86 0.77 0.89 0.85 0.84 0.75 0.84 0.71 0.84...
Question Help The following data represent the weights (in grams) of a random sample of 50 candies.
0.85
0.89
0.82
0.81
0.85
0.87
0.96
0.89
0.91
0.91
0.81
0.86
0.77
0.89
0.85
0.84
0.75
0.84
0.71
0.84
0.91
0.76
0.77
0.95
0.83
0.91
0.88
0.85
0.83
0.78
0.97
0.84
0.75
0.75
0.81
0.76
0.86
0.87
0.86
0.79
0.73
0.95
0.73
0.71
0.83
0.82
0.88
0.93
0.91
0.83
(a) Determine the sample standard deviation weight. = __?__ gram
(Round to two decimal places as needed.)
Homework Answers
Add Answer to:
Question Help The following data represent the weights (in grams) of a random sample of 50 candies. 0.85 0.89 0.82 0.81 0.85 0.87 0.96 0.89 0.91 0.91 0.81 0.86 0.77 0.89 0.85 0.84 0.75 0.84 0.71 0.84...
The following data represent the weights (in grams) of a random sample of 50 candies. 0.82...
 The following data represent the weights (in grams) of a random sample of 50 candies. 0.82 0.81 0.91 0.95 0.74 0.89 0.87 0.75 0.81 0.95 0.88 0.78 0.76 0.75 0.71 0.84 0.87 0.91 0.75 0.75 0.85 0.96 0.85 0.81 0.83 0.88 0.83 0.94 0.76 0.83 0.97 0.71 0.85 0.81 0.85 0.81 0.83 0.86 0.86 0.91 0.82 0.71 0.83 0.86 0.92 0.82 0.82 0.78 0.77 0.81 (a) Determine the sample standard deviation weight. S= gram (Round to two decimal places as...
The following data represent the weights (in grams) of a random sample of 50 candies. 0.82...
 The following data represent the weights (in grams) of a random sample of 50 candies. 0.82 0.81 0.91 0.95 0.74 0.89 0.87 0.75 0.81 0.95 0.88 0.78 0.76 0.75 0.71 0.84 0.87 0.91 0.75 0.75 0.85 0.96 0.85 0.81 0.83 0.88 0.83 0.94 0.76 0.83 0.97 0.71 0.85 0.81 0.85 0.81 0.83 0.86 0.86 0.91 0.82 0.71 0.83 0.86 0.92 0.82 0.82 0.78 0.77 0.81 (a) Determine the sample standard deviation weight. s= 0.07 gram (Round to two decimal places...
I need help at the bottom with - (d) Determine the actual percentage of candies that...
I need help at the bottom with - (d) Determine the actual percentage of candies that weigh between 0.7 and 0.98 gram, inclusive - Thank you! The following data represent the weights (in grams) of a random sample of 50 candies. 0.85 0.89 0.82 0.81 0.85 0.87 0.96 0.89 0.91 0.91 0.81 0.86 0.77 0.89 0.85 0.84 0.75 0.84 0.71 0.84 0.91 0.76 0.77 0.95 0.83 0.91 0.88 0.85 0.83 0.78 0.97 0.84 0.75 0.75 0.81 0.76 0.86 0.87 0.86...
I need help with the final part - (f) Determine the actual percentage of candies that...
I need help with the final part - (f) Determine the actual percentage of candies that weigh more than 0.91 gram. - Thank you! The following data represent the weights (in grams) of a random sample of 50 candies. 0.85 0.89 0.82 0.81 0.85 0.87 0.96 0.89 0.91 0.91 0.81 0.86 0.77 0.89 0.85 0.84 0.75 0.84 0.71 0.84 0.91 0.76 0.77 0.95 0.83 0.91 0.88 0.85 0.83 0.78 0.97 0.84 0.75 0.75 0.81 0.76 0.86 0.87 0.86 0.79 0.73...
I need help with question (d) T 0.82 The following data represent the weights (in grams)...
 I need help with question (d)
T 0.82 The following data represent the weights (in grams) of a random sample of 50 candies. 0.89 0.87 0.87 0.84 0.95 0.81 0.94 0.97 0.75 0.76 0.75 0.78 0.84 0.85 0.82 0.92 0.78 0.72 0.83 0.81 0.82 0.82 0.82 0.87 0.81 0.91 0.78 0.81 0.96 0.72 0.86 0.84 0.86 0.94 0.74 0.82 0.87 0.92 0.89 0.86 0.91 0.85 0.84 0.79 0.77 0.81 0.78 0.87 0.74 (a) Determine the sample standard deviation weight. S=...
I need help with question (d)
T 0.82 The following data represent the weights (in grams) of a random sample of 50 candies. 0.89 0.87 0.87 0.84 0.95 0.81 0.94 0.97 0.75 0.76 0.75 0.78 0.84 0.85 0.82 0.92 0.78 0.72 0.83 0.81 0.82 0.82 0.82 0.87 0.81 0.91 0.78 0.81 0.96 0.72 0.86 0.84 0.86 0.94 0.74 0.82 0.87 0.92 0.89 0.86 0.91 0.85 0.84 0.79 0.77 0.81 0.78 0.87 0.74 (a) Determine the sample standard deviation weight. S=...
0.90 0.81 0.88 0.82 0.90 0.84 0.84 0.91 0.94 0.86 0.86 0.86 0.88 0.87 0.89 0.91...
 0.90 0.81 0.88 0.82 0.90 0.84 0.84 0.91 0.94 0.86 0.86 0.86 0.88 0.87 0.89 0.91 0.86 0.87 0.93 0.88 0.83 0.95 0.87 0.93 0.91 0.85 0.89 0.91 0.91 0.86 0.87 0.84 0.78 0.88 0.88 0.89 0.82 0.83 0.8 0.90 0.88 0.84 0.93 0.90 0.86 0.88 0.92 0.85 0.84 0.84 Another measure of central tendency is the trimmed mean. It is computed by determining the mean of a data set after deleting the smallest and largest observed values. Compute the...
The data to the right represent the weights (in grams) of a random sample of 50...
 The data to the right represent the weights (in grams) of a random sample of 50 candies. Complete parts (a) through (f). 0.89 0.85 0.91 0.95 0.75 0.85 0.86 0.75 0.82 0.98 0.86 0.79 0.77 0.75 0.71 0.83 0.82 0.92 0.77 0.73 0.82 0.84 0.82 0.83 0.85 0.87 0.81 0.92 0.77 0.82 0.99 0.73 0.89 0.86 0.87 0.83 0.82 0.85 0.87 0.93 0.82 0.74 0.84 0.89 0.93 0.92 0.84 0.77 0.79 0.83 (a) Determine the sample standard deviation weight gram(s)...
The data to the right represent the weights (in grams) of a random sample of 50...
 The data to the right represent the weights (in grams) of a random sample of 50 candies. 0.82 0.83 0.91 0.99 0.71 0.87 0.88 0.76 0.85 0.98 0.87 0.79 0.78 0.77 0.73 0.85 0.89 0.94 0.78 0.75 0.82 0.98 0.81 0.83 0.81 0.89 0.81 0.91 0.78 0.81 0.98 0.72 0.88 0.82 0.89 0.84 0.84 0.89 0.88 0.94 0.81 0.71 0.84 0.85 0.94 0.85 0.82 0.77 0.76 0.84 Complete parts (a) through (f). (a) Determine the sample standard deviation weight. grams)...
Please answer each of the parts in the following question. Show all steps. Thanks in advance!...
 Please answer each of the parts in the following question. Show
all steps. Thanks in advance!
The following data represent the weights (in grams) of a random sample of 50 candies. 0.86 0.84 0.93 0.99 0.73 0.85 0.87 0.77 0.82 0.83 0.82 0.78 0.76 10.75 0.75 0.84 0.86 0.93 0.77 0.74 0.83 0.99 0.83 0.83 0.85 0.86 0.81 0.95 0.79 0.83 0.96 0.75 0.88 0.86 0.88 0.85 0.82 0.87 0.86 0.91 0.87 0.74 0.83 0.85 0.93 0.87 0.84 0.74 0.77...
Please answer each of the parts in the following question. Show
all steps. Thanks in advance!
The following data represent the weights (in grams) of a random sample of 50 candies. 0.86 0.84 0.93 0.99 0.73 0.85 0.87 0.77 0.82 0.83 0.82 0.78 0.76 10.75 0.75 0.84 0.86 0.93 0.77 0.74 0.83 0.99 0.83 0.83 0.85 0.86 0.81 0.95 0.79 0.83 0.96 0.75 0.88 0.86 0.88 0.85 0.82 0.87 0.86 0.91 0.87 0.74 0.83 0.85 0.93 0.87 0.84 0.74 0.77...
i need help with with c and d. im using the T1-84 calculator for my class....
 i need help with with c and d. im using the T1-84 calculator
for my class. thank you
X23. The Empirical Rule The following data represent the weights (in grams) of a random sample of 50 M&M plain candies. 0.87 0.88 0.82 0.90 0.90 0.84 0.84 0.91 0.94 0.86 0.86 0.86 0.88 0.87 0.89 0.91 0.86 0.87 0.93 0.88 0.83 0.95 0.87 0.93 0.91 0.85 0.91 0.91 0.86 0.89 0.87 0.84 0.88 0.88 0.89 0.79 0.82 0.83 0.90 0.88 0.84...
i need help with with c and d. im using the T1-84 calculator
for my class. thank you
X23. The Empirical Rule The following data represent the weights (in grams) of a random sample of 50 M&M plain candies. 0.87 0.88 0.82 0.90 0.90 0.84 0.84 0.91 0.94 0.86 0.86 0.86 0.88 0.87 0.89 0.91 0.86 0.87 0.93 0.88 0.83 0.95 0.87 0.93 0.91 0.85 0.91 0.91 0.86 0.89 0.87 0.84 0.88 0.88 0.89 0.79 0.82 0.83 0.90 0.88 0.84...
 The following data represent the weights (in grams) of a random sample of 50 candies. 0.82 0.81 0.91 0.95 0.74 0.89 0.87 0.75 0.81 0.95 0.88 0.78 0.76 0.75 0.71 0.84 0.87 0.91 0.75 0.75 0.85 0.96 0.85 0.81 0.83 0.88 0.83 0.94 0.76 0.83 0.97 0.71 0.85 0.81 0.85 0.81 0.83 0.86 0.86 0.91 0.82 0.71 0.83 0.86 0.92 0.82 0.82 0.78 0.77 0.81 (a) Determine the sample standard deviation weight. S= gram (Round to two decimal places as...
 The following data represent the weights (in grams) of a random sample of 50 candies. 0.82 0.81 0.91 0.95 0.74 0.89 0.87 0.75 0.81 0.95 0.88 0.78 0.76 0.75 0.71 0.84 0.87 0.91 0.75 0.75 0.85 0.96 0.85 0.81 0.83 0.88 0.83 0.94 0.76 0.83 0.97 0.71 0.85 0.81 0.85 0.81 0.83 0.86 0.86 0.91 0.82 0.71 0.83 0.86 0.92 0.82 0.82 0.78 0.77 0.81 (a) Determine the sample standard deviation weight. s= 0.07 gram (Round to two decimal places...
 I need help with question (d)
T 0.82 The following data represent the weights (in grams) of a random sample of 50 candies. 0.89 0.87 0.87 0.84 0.95 0.81 0.94 0.97 0.75 0.76 0.75 0.78 0.84 0.85 0.82 0.92 0.78 0.72 0.83 0.81 0.82 0.82 0.82 0.87 0.81 0.91 0.78 0.81 0.96 0.72 0.86 0.84 0.86 0.94 0.74 0.82 0.87 0.92 0.89 0.86 0.91 0.85 0.84 0.79 0.77 0.81 0.78 0.87 0.74 (a) Determine the sample standard deviation weight. S=...
I need help with question (d)
T 0.82 The following data represent the weights (in grams) of a random sample of 50 candies. 0.89 0.87 0.87 0.84 0.95 0.81 0.94 0.97 0.75 0.76 0.75 0.78 0.84 0.85 0.82 0.92 0.78 0.72 0.83 0.81 0.82 0.82 0.82 0.87 0.81 0.91 0.78 0.81 0.96 0.72 0.86 0.84 0.86 0.94 0.74 0.82 0.87 0.92 0.89 0.86 0.91 0.85 0.84 0.79 0.77 0.81 0.78 0.87 0.74 (a) Determine the sample standard deviation weight. S=...
 0.90 0.81 0.88 0.82 0.90 0.84 0.84 0.91 0.94 0.86 0.86 0.86 0.88 0.87 0.89 0.91 0.86 0.87 0.93 0.88 0.83 0.95 0.87 0.93 0.91 0.85 0.89 0.91 0.91 0.86 0.87 0.84 0.78 0.88 0.88 0.89 0.82 0.83 0.8 0.90 0.88 0.84 0.93 0.90 0.86 0.88 0.92 0.85 0.84 0.84 Another measure of central tendency is the trimmed mean. It is computed by determining the mean of a data set after deleting the smallest and largest observed values. Compute the...
 The data to the right represent the weights (in grams) of a random sample of 50 candies. Complete parts (a) through (f). 0.89 0.85 0.91 0.95 0.75 0.85 0.86 0.75 0.82 0.98 0.86 0.79 0.77 0.75 0.71 0.83 0.82 0.92 0.77 0.73 0.82 0.84 0.82 0.83 0.85 0.87 0.81 0.92 0.77 0.82 0.99 0.73 0.89 0.86 0.87 0.83 0.82 0.85 0.87 0.93 0.82 0.74 0.84 0.89 0.93 0.92 0.84 0.77 0.79 0.83 (a) Determine the sample standard deviation weight gram(s)...
 The data to the right represent the weights (in grams) of a random sample of 50 candies. 0.82 0.83 0.91 0.99 0.71 0.87 0.88 0.76 0.85 0.98 0.87 0.79 0.78 0.77 0.73 0.85 0.89 0.94 0.78 0.75 0.82 0.98 0.81 0.83 0.81 0.89 0.81 0.91 0.78 0.81 0.98 0.72 0.88 0.82 0.89 0.84 0.84 0.89 0.88 0.94 0.81 0.71 0.84 0.85 0.94 0.85 0.82 0.77 0.76 0.84 Complete parts (a) through (f). (a) Determine the sample standard deviation weight. grams)...
 Please answer each of the parts in the following question. Show
all steps. Thanks in advance!
The following data represent the weights (in grams) of a random sample of 50 candies. 0.86 0.84 0.93 0.99 0.73 0.85 0.87 0.77 0.82 0.83 0.82 0.78 0.76 10.75 0.75 0.84 0.86 0.93 0.77 0.74 0.83 0.99 0.83 0.83 0.85 0.86 0.81 0.95 0.79 0.83 0.96 0.75 0.88 0.86 0.88 0.85 0.82 0.87 0.86 0.91 0.87 0.74 0.83 0.85 0.93 0.87 0.84 0.74 0.77...
Please answer each of the parts in the following question. Show
all steps. Thanks in advance!
The following data represent the weights (in grams) of a random sample of 50 candies. 0.86 0.84 0.93 0.99 0.73 0.85 0.87 0.77 0.82 0.83 0.82 0.78 0.76 10.75 0.75 0.84 0.86 0.93 0.77 0.74 0.83 0.99 0.83 0.83 0.85 0.86 0.81 0.95 0.79 0.83 0.96 0.75 0.88 0.86 0.88 0.85 0.82 0.87 0.86 0.91 0.87 0.74 0.83 0.85 0.93 0.87 0.84 0.74 0.77...
 i need help with with c and d. im using the T1-84 calculator
for my class. thank you
X23. The Empirical Rule The following data represent the weights (in grams) of a random sample of 50 M&M plain candies. 0.87 0.88 0.82 0.90 0.90 0.84 0.84 0.91 0.94 0.86 0.86 0.86 0.88 0.87 0.89 0.91 0.86 0.87 0.93 0.88 0.83 0.95 0.87 0.93 0.91 0.85 0.91 0.91 0.86 0.89 0.87 0.84 0.88 0.88 0.89 0.79 0.82 0.83 0.90 0.88 0.84...
i need help with with c and d. im using the T1-84 calculator
for my class. thank you
X23. The Empirical Rule The following data represent the weights (in grams) of a random sample of 50 M&M plain candies. 0.87 0.88 0.82 0.90 0.90 0.84 0.84 0.91 0.94 0.86 0.86 0.86 0.88 0.87 0.89 0.91 0.86 0.87 0.93 0.88 0.83 0.95 0.87 0.93 0.91 0.85 0.91 0.91 0.86 0.89 0.87 0.84 0.88 0.88 0.89 0.79 0.82 0.83 0.90 0.88 0.84...
Most questions answered within 3 hours.
-
Write a function makePoly(x,y,n,l) that receives a coordinate
point (x,y), an integer n representing the desired...
asked 1 minute ago -
write an essay about How can the use of paper straws
have an impact on the...
asked 2 minutes ago -
A person pulls on a container on a horizontal frictionless
surface with a force of 110...
asked 5 minutes ago -
A complex number is a number of the form a + bi, where a and b...
asked 5 minutes ago -
30 people are selected randomly from a certain town.
If their mean age is 32.2 and...
asked 14 minutes ago -
Consider the following program that reads a number of
nonnegative integers into an array and prints...
asked 12 minutes ago -
A lean manufacturing system basically removes all waste,
including inventory, as much as possible. An ideal...
asked 20 minutes ago -
Write a JAVA program to sort a given array of integers (1
Dimensional) in ascending order...
asked 31 minutes ago -
The table below shows the number of deaths in the U.S. in a year
due to...
asked 51 minutes ago -
The solubility of magnesium phosphate is 2.27 × 10⁻³ g/1.0 L of
solution. What is the...
asked 1 hour ago -
Two tugboats pull a disabled supertanker. Each tug exerts a
constant force of 1.20×10⁶ N ,...
asked 1 hour ago -
In the following concepts of economics provide a
discussion of the meaning as well as the...
asked 37 minutes ago