
Homework Answers
Given Data :
sample sapce = 5 and
after 25 samples have been collected. we calculate x bar =20 and R bar 4.56
a) the three control limits for X bar and R bar are:
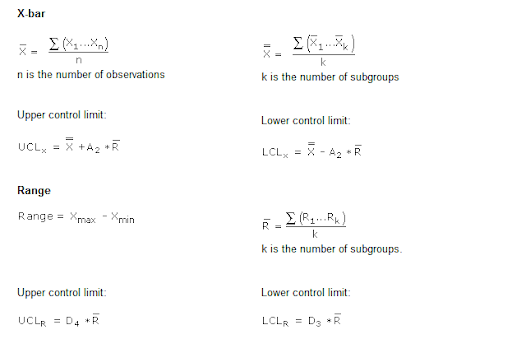

So,
The three-sigma control limits for xbar is
lower control limit :
20-0.153*4.56 =19.30232
upper control limit:
20+0.153*4.56 = 20.69768
the three-sigma control limits for R is
lower control limit :
0.459*4.56 =2.09304
upper control limit:
1.514*4.56 = 6.90384
(b)
We use Average of Subgroup Ranges to estimate the process standard
deviation:
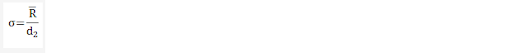
= 4.56/3.931
=1.1600
(c)
the conclusion regarding the process capability by assuming that the process output is normally distributed with the specifications are 19(+ or -)5
because the specificantions are within the range
(d)
The probability of not detecting this shift on the first
subsequent sample is
P(X<24) = P((X-mean)/s <(24-20)/1.16001)
=P(Z<3.45)
=0.9997 (from standard normal table)
\\\\\\\\\\\\\\\\\\\\\\\\\\\\\\\\\\\\\\\\\\\\\\\\\\\\\\\\\\\\\\\\\\\\\
THANK YOU
Add Answer to:
Samples of n5 units are taken from a process every hour. The and R values for a particular quality char acteristic are determined. After 25 samples have been collected, we calculate 20 and R 4.56 (a)...
Samples of n5 units are taken from a process every hour. The and R values for...
 Samples of n5 units are taken from a process every hour. The and R values for a particular quality char acteristic are determined. After 25 samples have been collected, we calculate 20 and R 4.56 (a) What are the three-sigma control limits for x and R? (b) Both charts exhibit control. Estimate the process standard deviation (c) Assume that the process output is normally dis- tributed. If the specifications are 19 t 5, what are your conclusions regarding the process...
Wakanda Process Manufacturing Samples of n =5 units are taken from a process every hour. The...
Wakanda Process Manufacturing Samples of n =5 units are taken from a process every hour. The x̄ and R̄ values for a particular quality characteristic are determined. After 25 samples have been collected, we calculate x̄ = 20 and R̄ = 4.56. (a) What are the three- sigma control limit for x̄ and R? (b) Both charts exhibit control. Estimate the process standard deviation. (c) Assume that the process output is normally distributed. If the specifications are 19 ± 5,...
Samples of n = 6 items each are taken from a process at regular intervals. A...
Samples of n = 6 items each are taken from a process at regular intervals. A quality characteristic is measured, and x-bar and R values are calculated for each sample. After 50 samples, we have Compute control limits for the x-bar and R control charts. All points on both control charts fall between the control limits computed in part (a). What are the natural tolerance limits of the process? If the specification limits are 41 ± 5.0, what are your...
 Samples of n5 units are taken from a process every hour. The and R values for a particular quality char acteristic are determined. After 25 samples have been collected, we calculate 20 and R 4.56 (a) What are the three-sigma control limits for x and R? (b) Both charts exhibit control. Estimate the process standard deviation (c) Assume that the process output is normally dis- tributed. If the specifications are 19 t 5, what are your conclusions regarding the process...
Most questions answered within 3 hours.
-
Using MARS simulator, write MIPS programs according to
the following scenarios: Receive a positive integer number...
asked 1 hour ago -
An object in front of a concave mirror has a real image that is
11.5 cm...
asked 1 hour ago -
Consider the reaction, C3 H8 + O2 --> CO2 + H2O. How many
moles of O2...
asked 3 hours ago -
You and your opponent both roll a fair die. If you both roll the
same number,...
asked 3 hours ago -
In a study of the accuracy of fast food drive-through orders,
Restaurant A had 257 accurate...
asked 3 hours ago -
Identify and describe in detail the four categories of
institutions that could be included in a...
asked 3 hours ago -
In python
class Customer:
def __init__(self, customer_id, last_name, first_name, phone_number, address):
self._customer_id = int(customer_id)
self._last_name =...
asked 3 hours ago -
What is an example of a limitation in implementing a new
ERP system and how it...
asked 3 hours ago -
In a section of 9.7cm of an artery with a radius of 2.6mm there
is a...
asked 3 hours ago -
the two carboxylic acid groups of aspartic acid have different
acidities with pKa values of 2.1...
asked 3 hours ago -
Would CuCO3 aqueous salt combined with calcium chloride
form a solid precipitate? If so, what would...
asked 3 hours ago -
How do ECM Solutions assist in embedding a culture of continuous
improvement in an organization? (Project...
asked 4 hours ago