22.HE.A: It has been assumed that children are born with equal frequency with respect to days of the week. Randomly selected birth records are obtained and results are listed in the table below. S...
22.HE.A: It has been assumed that children are born with equal frequency with respect to days of the week. Randomly selected birth records are obtained and results are listed in the table below.
|
Sunday |
Monday |
Tuesday |
Wednesday |
Thursday |
Friday |
Saturday |
|
36 |
55 |
62 |
60 |
60 |
58 |
48 |
- State the test that should be used.
- Write the null and alternative hypotheses.
- Check the three conditions.
- How many degrees of freedom should we use in the χ2 test?
- Compute the χ2 statistic and p-value.
- Which cell contributed the most to the χ2? Which one contributed the least?
- State the conclusion in context.
Homework Answers
a)
Chi Square test of goodness of fit
b)
Null and Alternative Hypotheses
c)
The following conditions are all satisfied:
- The sampling method used is simple random sampling.
- The variable under study - Day of the week is categorical.
- The expected value of the number of sample observations in each level of the variable is at least 5.
d)
Based on the information provided, the significance level is α=0.05, the number of degrees of freedom is df=7−1=6
e)
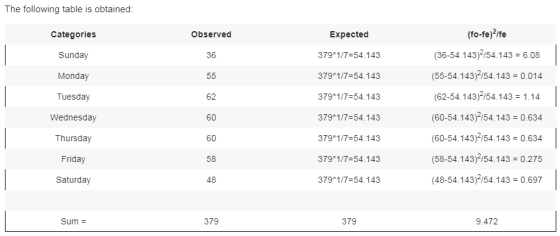
Test Statistics
The Chi-Squared statistic is computed as follows:

f)
Maximum - Sunday
Minimum - Monday
g)
At 5% level of significance, since it is observed that χ2=9.472≤χc2=12.592, it is then concluded that the null hypothesis is not rejected.Therefore, there is NOT enough evidence to claim that some of the population proportions differ from those stated in the null hypothesis, at the \α=0.05 significance level.
Please let me know in comments in case anything is unclear. Will reply ASAP. Do upvote if satisfied!
Add Answer to:
22.HE.A: It has been assumed that children are born with equal frequency with respect to days of the week. Randomly selected birth records are obtained and results are listed in the table below. S...
Randomly selected birth records were obtained, and categorized as listed in the table to the right....
Randomly selected birth records were obtained, and categorized as listed in the table to the right. Use a 0.01 0.01 significance level to test the reasonable claim that births occur with equal frequency on the different days of the week. How might the apparent lower frequencies on Saturday and Sunday be explained? Day nbsp Day Sun Mon Tues Wed Thurs Fri Sat Number of Births Number of Births 48 48 64 64 61 61 60 60 56 56 65 65...
accidents were uniformly distributed over the days of the week. The data n 317 randomly selected...
 accidents were uniformly distributed over the days of the week. The data n 317 randomly selected accidents. Is there reason to believe that the accident occurs with un 1. A researcher wanted to determine whether certain for equal frequenay with respect to the day of the week at the a 0.05 level of significance? Click the icon to view the table Let p, the proportion of accidents on day i. where i 1 for Sunday, 2 for Monday, etc. What...
Randomly selected birth records were obtained, and categorized as listed in the table to the right....
Randomly selected birth records were obtained, and categorized as listed in the table to the right. Use a 0.01 significance level to test the reasonable claim that births occur with equal frequency on the different days of the week. How might the apparent lower frequencies on Saturday and Sunday be explained? DAY SUN MON TUES WED THURS FRI SAT NUMBER OF BIRTHS 39 56 62 55 55 61 50 1. Determine the null and alternative hypotheses. Ho = H1 =...
Are phone calls equally likely to occur any day of the week? The day of the...
Are phone calls equally likely to occur any day of the week? The day of the week for each of 504 randomly selected phone calls was observed. The results are displayed in the table below. Use an αα = 0.05 significance level. Complete the rest of the table by filling in the expected frequencies: Frequencies of Phone Calls for Each Day of the Week Outcome Frequency Expected Frequency Sunday 56 Monday 52 Tuesday 61 Wednesday 92 Thursday 73 Friday...
Are phone calls equally likely to occur any day of the week? The day of the...
 Are phone calls equally likely to occur any day of the week? The day of the week for each of 700 randomly selected phone calls was observed. The results are displayed in the table below. Use an a=0.01 significance level. a. Complete the rest of the table by filling in the expected frequencies: Frequencies of Phone Calls for Each Day of the Week Outcome Frequency Expected Frequency Sunday 112 Monday 120 Tuesday 115 Wednesday 87 Thursday 73 Friday 91 Saturday...
Are phone calls equally likely to occur any day of the week? The day of the...
Are phone calls equally likely to occur any day of the week? The day of the week for each of 525 randomly selected phone calls was observed. The results are displayed in the table below. Use an αα = 0.05 significance level. Complete the rest of the table by filling in the expected frequencies: Frequencies of Phone Calls for Each Day of the Week Outcome Frequency Expected Frequency Sunday 80 Monday 73 Tuesday 69 Wednesday 71 Thursday 80 Friday...
Timelimit: 3 hours. x] Show Intro/Instructions Are phone calls equally likely to occur any day of...
 Timelimit: 3 hours. x] Show Intro/Instructions Are phone calls equally likely to occur any day of the week? The day of the week for each of 434 randomly selected phone calls was observed. The results are displayed in the table below. Use an a = 0.10 significance level. a. Complete the rest of the table by filling in the expected frequencies: Frequencies of Phone Calls for Each Day of the Week Outcome Frequency Expected Frequency Sunday 62 Monday 56 Tuesday...
6. Pedestrian Deaths A researcher wanted to determinse whether pedestrian deaths were uniformly distributed over the days of the week. She randomly selected 300 pedestrian...
 6. Pedestrian Deaths A researcher wanted to determinse whether pedestrian deaths were uniformly distributed over the days of the week. She randomly selected 300 pedestrian deaths, recorded the day of the week on which the death occurred, and obtained the following results (the data are based on information obtained from the Insurance Institute for Highway Safety) Day of the Week Sunday Monday Tuesday Wednesday Frequency Day of Frequency the Week Thursday Friday Saturday 41 49 61 39 40 30 40...
anufacturer of colored candies states that 13% of the candies in a bag should be brown,...
 anufacturer of colored candies states that 13% of the candies in a bag should be brown, 14% yellow 13% red, 24% blue, 20% orange, and 16% green. A student random y selected a bag of colored candies. He counted the numbe candies of each color and obtained the results shown in the table. Test whether the bag of colored candies follows the distribution stated above at the α = 0.05 level of significance. EEB Click the icon to view the...
 accidents were uniformly distributed over the days of the week. The data n 317 randomly selected accidents. Is there reason to believe that the accident occurs with un 1. A researcher wanted to determine whether certain for equal frequenay with respect to the day of the week at the a 0.05 level of significance? Click the icon to view the table Let p, the proportion of accidents on day i. where i 1 for Sunday, 2 for Monday, etc. What...
 Are phone calls equally likely to occur any day of the week? The day of the week for each of 700 randomly selected phone calls was observed. The results are displayed in the table below. Use an a=0.01 significance level. a. Complete the rest of the table by filling in the expected frequencies: Frequencies of Phone Calls for Each Day of the Week Outcome Frequency Expected Frequency Sunday 112 Monday 120 Tuesday 115 Wednesday 87 Thursday 73 Friday 91 Saturday...
 Are phone calls equally likely to occur any day of the week? The day of the week for each of 700 randomly selected phone calls was observed. The results are displayed in the table below. Use an a=0.01 significance level. a. Complete the rest of the table by filling in the expected frequencies: Frequencies of Phone Calls for Each Day of the Week Outcome Frequency Expected Frequency Sunday 112 Monday 120 Tuesday 115 Wednesday 87 Thursday 73 Friday 91 Saturday...
 Timelimit: 3 hours. x] Show Intro/Instructions Are phone calls equally likely to occur any day of the week? The day of the week for each of 434 randomly selected phone calls was observed. The results are displayed in the table below. Use an a = 0.10 significance level. a. Complete the rest of the table by filling in the expected frequencies: Frequencies of Phone Calls for Each Day of the Week Outcome Frequency Expected Frequency Sunday 62 Monday 56 Tuesday...
 6. Pedestrian Deaths A researcher wanted to determinse whether pedestrian deaths were uniformly distributed over the days of the week. She randomly selected 300 pedestrian deaths, recorded the day of the week on which the death occurred, and obtained the following results (the data are based on information obtained from the Insurance Institute for Highway Safety) Day of the Week Sunday Monday Tuesday Wednesday Frequency Day of Frequency the Week Thursday Friday Saturday 41 49 61 39 40 30 40...
 anufacturer of colored candies states that 13% of the candies in a bag should be brown, 14% yellow 13% red, 24% blue, 20% orange, and 16% green. A student random y selected a bag of colored candies. He counted the numbe candies of each color and obtained the results shown in the table. Test whether the bag of colored candies follows the distribution stated above at the α = 0.05 level of significance. EEB Click the icon to view the...
Most questions answered within 3 hours.
-
The patient recovery time from a particular surgical procedure
is normally distributed with a mean of...
asked 48 seconds from now -
Python Program: Design the logic for and implement a program
that merges the two files into...
asked 14 minutes ago -
Human relations refer to the way a company arranges people,
jobs, and communications so that work...
asked 16 minutes ago -
The specific radiocarbon activity of a sample of wood is 6.25
gms dpm/gm of carbon. The...
asked 19 minutes ago -
An aqueous magnesium chloride solution is made by dissolving
6.96 moles of MgCl2 in sufficient water...
asked 22 minutes ago -
Ken believes the average age of men who come to get a haircut at
his barber...
asked 44 minutes ago -
(Ratio Analysis): Last year Co. XYZ had sales of $ 400,000, with
“cost of goods sold”...
asked 52 minutes ago -
can someone please write the balanced chemical
equation for the synthesis of Bromoacetanilide
from;
aniline +...
asked 48 minutes ago -
1. If a corporation purchases land and building and subsequently
tears down the building and uses...
asked 59 minutes ago -
Consider a 23-year bond with 7 percent annual coupon payments.
The market rate (YTM) is 6.4...
asked 1 hour ago -
a tuba creates a 4th harmonic of frequency 116.5 Hz. what is the
frequency of the...
asked 1 hour ago -
A coconut mass 2kg falls from a 30m tall tree. The coconut falls
and comes to...
asked 1 hour ago