Chemistry help!
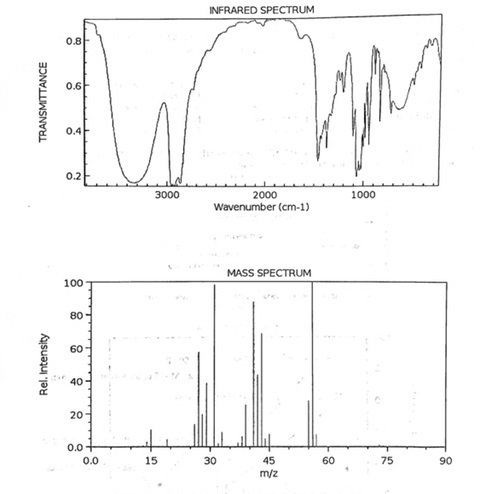
What compound is this? The IR Spectrum and Mass Spectrum graphs are below:
Please identify peaks and explain, thanks!
Homework Answers

Add Answer to:
Chemistry help! What compound is this? The IR Spectrum and Mass Spectrum graphs are below: Please identify peaks and explain, thanks! INFRARED SPECTRUM 0.8 0.6 0.4F 0.2 3000 2000 Wavenumber (cm-1) 10...
CYCLOHEXANONE INFRARED SPECTRUM 0.8 0.6F 0.4 0.2 0.0 3000 2000 Wavenumber (em-1) 1000 NIST Chemistry WebBook...
 CYCLOHEXANONE INFRARED SPECTRUM 0.8 0.6F 0.4 0.2 0.0 3000 2000 Wavenumber (em-1) 1000 NIST Chemistry WebBook (httpsllwebbook.nist.govlchemistry) CYCLOHEXANOL INFRARED SPECTRUM 0.8 0.6 0.4 0.2 3000 2000 wavenumber (cm-1 ) 1000 NIST Chemistry WebBook (https //webbook.nist.govlchemistry)
ACETIC ACID, 3-METHYLBUTYL ESTER INFRARED SPECTRUM 0.8 0.6 0.4 0.2 3000 1000 2000 Wavenumber (cm-1) (5pts)...
 ACETIC ACID, 3-METHYLBUTYL ESTER INFRARED SPECTRUM 0.8 0.6 0.4 0.2 3000 1000 2000 Wavenumber (cm-1) (5pts) 1. Upload a picture of your drawn separation scheme for isopentyl acetate from the reaction mixture. Maximum size for new files 20.00MB Maximum attachments 2 Drag and drop a file or folder here or click (5pts) 2. Give the approximate locations in cm1 of three significant peaks in the provided IR spectrum and identify the bond in isopentyl acetate corresponding to it. Saved Normal...
Which signature peaks make up the benzil compound? Please include everything even aromatic peaks BENZIL INFRARED...
 Which signature peaks make up the benzil compound? Please
include everything even aromatic peaks
BENZIL INFRARED SPECTRUM 0.8 0.6 Transmitance 0.4 0.2 1000 3000 2000 Wavenumber (cm-1) NIST Chemistry WebBook (https://webbook.nist.gov/chemistry)
Which signature peaks make up the benzil compound? Please
include everything even aromatic peaks
BENZIL INFRARED SPECTRUM 0.8 0.6 Transmitance 0.4 0.2 1000 3000 2000 Wavenumber (cm-1) NIST Chemistry WebBook (https://webbook.nist.gov/chemistry)
Which spectrum, A or B, is that of a nitro compound (Give specific wavenumbers)? Explain why...
 Which spectrum, A or B, is that of a nitro compound (Give specific wavenumbers)? Explain why you chose spectrum A or B. You must justify your answer 2. 0.8 0.6 Spectrum A 2 0.4 0.2 0.0 4000 3000 2000 1000 Wavenumber (cm-1) 1 0.8ト 0.6 Spectrum B 0.4F 0.2 3000 2000 1000 Wavenumber (cm-1)
Identify all of the important peaks in the ethanol IR spectrum. ETHANOL INFRARED SPECTRUM Transmitance 3000...
 Identify all of the important peaks in the ethanol IR
spectrum.
ETHANOL INFRARED SPECTRUM Transmitance 3000 1000 2000 Wavenumber (cm-1)
Identify all of the important peaks in the ethanol IR
spectrum.
ETHANOL INFRARED SPECTRUM Transmitance 3000 1000 2000 Wavenumber (cm-1)
9) The IR spectrum for Compound 9 is shown below. INFRARED SPECTRUM 1 0.8 0.6 a...
 9) The IR spectrum for Compound 9 is shown below. INFRARED SPECTRUM 1 0.8 0.6 a 0.4 3000 2000 1000 Wavenumber (cm-1) Which one of the following compounds is most likely to be Compound 9? a) 1-cyano-3-methylbenzene b) 1-cyano-4-methylbenzene c) (1-methylphenyl)ethyne d) (4-methylphenyl)ethyne e) m-methylbenzaldehyde f) p-methylbenzaldehyde 2
4. What functional groups are present in the molecules that gave rise to the following IR...
 4. What functional groups are present in the molecules that gave rise to the following IR Spectra? 0.8 O0.6 4 0.2 0.0 3000 2000 Wavenumber (cm-1) 1000 NIST Chemistry WebBook (http://webbook.nist.gov/chemistry) INFRARED SPECTRUM 0.8 2 0.6 0.4 0.2 3000 2000 1000 Wavenumber (cm-1) NIST Chemistry WebBook (http://webbook.nist.gov/chemistry)
Analyze the IR spectra of bromobenzene Benzene, bromo- INFRARED SPECTRUM TRANSMITTANCE 1000 3000 2000 Wavenumber (cm-1)
 Analyze the IR spectra of bromobenzene
Benzene, bromo- INFRARED SPECTRUM TRANSMITTANCE 1000 3000 2000 Wavenumber (cm-1)
Analyze the IR spectra of bromobenzene
Benzene, bromo- INFRARED SPECTRUM TRANSMITTANCE 1000 3000 2000 Wavenumber (cm-1)
Assign the peak for both of the IR spectrum below and identify what compound is this...
 Assign the peak for both of the IR spectrum below and identify
what compound is this and draw the structure of the compound.
100 90 80 70 W 60 50 % Transmission 40 30 - 923 1677 1285 20 - 702 10 0 4000 3500 3000 2500 2000 1500 1000 Wavenumber (cm) 100 80 m % Transmission 1660 1209 1438 886 757 0 4000 3500 3000 2500 1500 1000 2000 Wavenumber (cm*')
Assign the peak for both of the IR spectrum below and identify
what compound is this and draw the structure of the compound.
100 90 80 70 W 60 50 % Transmission 40 30 - 923 1677 1285 20 - 702 10 0 4000 3500 3000 2500 2000 1500 1000 Wavenumber (cm) 100 80 m % Transmission 1660 1209 1438 886 757 0 4000 3500 3000 2500 1500 1000 2000 Wavenumber (cm*')
This can be solved without a NMR. 7) Identify the molecule from its IR and mass spectra below: MASS SPECTRUM INFRARED...
 This can be solved without a NMR.
7) Identify the molecule from its IR and mass spectra below: MASS SPECTRUM INFRARED SPECTRUM los Rel. Intensity Relative Transmittance 04 120 710 519 637 1701 060 0. 0L 20 3000 1000 140 40 60 80 2000 120 100 Wavenumber(cm-1)
This can be solved without a NMR.
7) Identify the molecule from its IR and mass spectra below: MASS SPECTRUM INFRARED SPECTRUM los Rel. Intensity Relative Transmittance 04 120 710 519 637 1701 060 0. 0L 20 3000 1000 140 40 60 80 2000 120 100 Wavenumber(cm-1)
 CYCLOHEXANONE INFRARED SPECTRUM 0.8 0.6F 0.4 0.2 0.0 3000 2000 Wavenumber (em-1) 1000 NIST Chemistry WebBook (httpsllwebbook.nist.govlchemistry) CYCLOHEXANOL INFRARED SPECTRUM 0.8 0.6 0.4 0.2 3000 2000 wavenumber (cm-1 ) 1000 NIST Chemistry WebBook (https //webbook.nist.govlchemistry)
 ACETIC ACID, 3-METHYLBUTYL ESTER INFRARED SPECTRUM 0.8 0.6 0.4 0.2 3000 1000 2000 Wavenumber (cm-1) (5pts) 1. Upload a picture of your drawn separation scheme for isopentyl acetate from the reaction mixture. Maximum size for new files 20.00MB Maximum attachments 2 Drag and drop a file or folder here or click (5pts) 2. Give the approximate locations in cm1 of three significant peaks in the provided IR spectrum and identify the bond in isopentyl acetate corresponding to it. Saved Normal...
 Which signature peaks make up the benzil compound? Please
include everything even aromatic peaks
BENZIL INFRARED SPECTRUM 0.8 0.6 Transmitance 0.4 0.2 1000 3000 2000 Wavenumber (cm-1) NIST Chemistry WebBook (https://webbook.nist.gov/chemistry)
Which signature peaks make up the benzil compound? Please
include everything even aromatic peaks
BENZIL INFRARED SPECTRUM 0.8 0.6 Transmitance 0.4 0.2 1000 3000 2000 Wavenumber (cm-1) NIST Chemistry WebBook (https://webbook.nist.gov/chemistry)
 Which spectrum, A or B, is that of a nitro compound (Give specific wavenumbers)? Explain why you chose spectrum A or B. You must justify your answer 2. 0.8 0.6 Spectrum A 2 0.4 0.2 0.0 4000 3000 2000 1000 Wavenumber (cm-1) 1 0.8ト 0.6 Spectrum B 0.4F 0.2 3000 2000 1000 Wavenumber (cm-1)
 Identify all of the important peaks in the ethanol IR
spectrum.
ETHANOL INFRARED SPECTRUM Transmitance 3000 1000 2000 Wavenumber (cm-1)
Identify all of the important peaks in the ethanol IR
spectrum.
ETHANOL INFRARED SPECTRUM Transmitance 3000 1000 2000 Wavenumber (cm-1)
 9) The IR spectrum for Compound 9 is shown below. INFRARED SPECTRUM 1 0.8 0.6 a 0.4 3000 2000 1000 Wavenumber (cm-1) Which one of the following compounds is most likely to be Compound 9? a) 1-cyano-3-methylbenzene b) 1-cyano-4-methylbenzene c) (1-methylphenyl)ethyne d) (4-methylphenyl)ethyne e) m-methylbenzaldehyde f) p-methylbenzaldehyde 2
 4. What functional groups are present in the molecules that gave rise to the following IR Spectra? 0.8 O0.6 4 0.2 0.0 3000 2000 Wavenumber (cm-1) 1000 NIST Chemistry WebBook (http://webbook.nist.gov/chemistry) INFRARED SPECTRUM 0.8 2 0.6 0.4 0.2 3000 2000 1000 Wavenumber (cm-1) NIST Chemistry WebBook (http://webbook.nist.gov/chemistry)
 Analyze the IR spectra of bromobenzene
Benzene, bromo- INFRARED SPECTRUM TRANSMITTANCE 1000 3000 2000 Wavenumber (cm-1)
Analyze the IR spectra of bromobenzene
Benzene, bromo- INFRARED SPECTRUM TRANSMITTANCE 1000 3000 2000 Wavenumber (cm-1)
 Assign the peak for both of the IR spectrum below and identify
what compound is this and draw the structure of the compound.
100 90 80 70 W 60 50 % Transmission 40 30 - 923 1677 1285 20 - 702 10 0 4000 3500 3000 2500 2000 1500 1000 Wavenumber (cm) 100 80 m % Transmission 1660 1209 1438 886 757 0 4000 3500 3000 2500 1500 1000 2000 Wavenumber (cm*')
Assign the peak for both of the IR spectrum below and identify
what compound is this and draw the structure of the compound.
100 90 80 70 W 60 50 % Transmission 40 30 - 923 1677 1285 20 - 702 10 0 4000 3500 3000 2500 2000 1500 1000 Wavenumber (cm) 100 80 m % Transmission 1660 1209 1438 886 757 0 4000 3500 3000 2500 1500 1000 2000 Wavenumber (cm*')
 This can be solved without a NMR.
7) Identify the molecule from its IR and mass spectra below: MASS SPECTRUM INFRARED SPECTRUM los Rel. Intensity Relative Transmittance 04 120 710 519 637 1701 060 0. 0L 20 3000 1000 140 40 60 80 2000 120 100 Wavenumber(cm-1)
This can be solved without a NMR.
7) Identify the molecule from its IR and mass spectra below: MASS SPECTRUM INFRARED SPECTRUM los Rel. Intensity Relative Transmittance 04 120 710 519 637 1701 060 0. 0L 20 3000 1000 140 40 60 80 2000 120 100 Wavenumber(cm-1)
Most questions answered within 3 hours.
-
A motor produces a torque of 0.25 N m at an angular velocity of
7200 revolutions...
asked 10 minutes ago -
***Please answer the below java question***
Are static methods inheritable? Can they be overridden?
asked 12 minutes ago -
In reaching her destination, a backpacker walks with an average
velocity of 1.13 m/s, due west....
asked 12 minutes ago -
Write two C programs that run a
server program and a client program concurrently.
Server program:...
asked 11 minutes ago -
Executive Program Practical Connection Assignment
Subject : Operations Security.
Assignment:
Provide a reflection of at least...
asked 21 minutes ago -
Every time Casey is at bat he has a 0.4 probability of
getting on base (assume...
asked 30 minutes ago -
The Walston Company is to be liquidated and has the following
liabilities:
Income taxes
$
9,400...
asked 37 minutes ago -
If
the more comprehensive data is available in MEPS, why does the NHIS
still exist? How...
asked 58 minutes ago -
Koo argues that the Japanese economy in the 1990s suffered from
a balance sheet recession. What...
asked 51 minutes ago -
Automobile mechanics conduct diagnosis tests on 150 new cars of
particular make and model to determine...
asked 45 minutes ago -
11) Find the proceeds of a 5 year non-interest
bearing note for $6500 discounted 2.5 years...
asked 52 minutes ago -
Required: Prepare the consolidated financial statements of
Griffin Ltd at 30 June 2019.
Griffin Ltd is...
asked 1 hour ago