

Homework Answers

Add Answer to:
A statistical program is recommended The following observations are on stopping distance (ft) of a particular truck at 20 mph under specified experimental conditions 32.1 30.7 31.4 30.4 31.0 31.9 The...
The following observations are are on stopping distance (n) of a particular truck at 20 mph under specified experimental conditions. 32.1 30.9 314 30.4 31.0 31.9 opping distanoe is 30. A normal...
 The following observations are are on stopping distance (n) of a particular truck at 20 mph under specified experimental conditions. 32.1 30.9 314 30.4 31.0 31.9 opping distanoe is 30. A normal probability plot validates the assumption that stopping distance is normally distributed average stopping distance exceeds this maximum value? Test the appropriate hypotheses using a-.01 State the apprepriate hypotheses Оно: μ-30 He' μ * 30 Me: μ + 30 30 Ho: 30 calculate the test statistic and ermine the...
Please help me get the right values, I cannot figure it out. Please show your work. A statistical program is recommended The following observations are on stopping distance (ft) of a particular truc...
 Please help me get the right values, I cannot figure it out.
Please show your work.
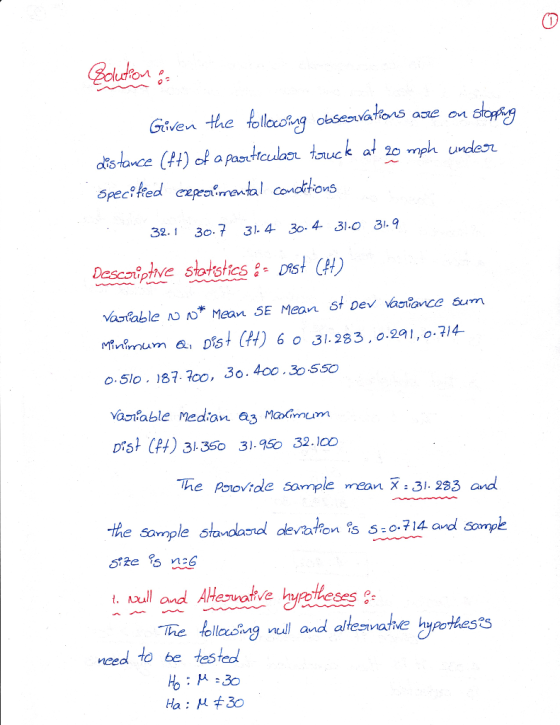
A statistical program is recommended The following observations are on stopping distance (ft) of a particular truck at 20 mph under specified experimental conditions 32.1 30.8 31.7 30.4 31.0 31.9 The report states that under these conditions, the maximum alowable stopping distance is 30. A normal probability plot validates the assumption that stopping distance is normally distributecd. (a) Does the data suggest that true...
Please help me get the right values, I cannot figure it out.
Please show your work.
A statistical program is recommended The following observations are on stopping distance (ft) of a particular truck at 20 mph under specified experimental conditions 32.1 30.8 31.7 30.4 31.0 31.9 The report states that under these conditions, the maximum alowable stopping distance is 30. A normal probability plot validates the assumption that stopping distance is normally distributecd. (a) Does the data suggest that true...
The desired percentage of SiO2 in a certain type of aluminous cement is 5.5. To test...
 The desired percentage of SiO2 in a certain type of aluminous cement is 5.5. To test whether the true average percentage is 5.5 for a particular production facility, 16 independently obtained samples are analyzed. Suppose that the percentage of SiO2 in a sample is normally distributed with σ = 0.30 and that x= 5.23. (Use α-0.05.) (a) Does this indicate conclusively that the true average percentage differs from 5.5? State the appropriate null and alternative hypotheses Hai μ < 5.5...
The desired percentage of SiO2 in a certain type of aluminous cement is 5.5. To test whether the ...
The desired percentage of SiO2 in a certain type of aluminous cement is 5.5. To test whether the true average percentage is 5.5 for a particular production facility, 16 independently obtained samples are analyzed. Suppose that the percentage of SiO2 in a sample is normally distributed with σ = 0.32 and that x = 5.22. (Use α = 0.05.) (a) Does this indicate conclusively that the true average percentage differs from 5.5? State the appropriate null and alternative hypotheses. H0:...
Consider the following random sample observations on stabilized viscosity of asphalt specimens. 2061 2099 1982 1842...
 Consider the following random sample observations on stabilized viscosity of asphalt specimens. 2061 2099 1982 1842 2052 Suppose that for a particular application, it is required that true average viscosity be 2000. Is there evidence this requirement is not satisfied? From previous findings we know that the population standard deviation, σ State the appropriate hypotheses. (Use α-0.05.) 90.8 Ho: μ < 2000 Hai μ 2000 Ho: μ 2000 Ha: μ 2000 Ho: μ 2000 Hai μ-2000 Ho: μ > 2000...
The desired percentage of Sio2 in a certain type of aluminous cement is 5.5
The desired percentage of Sio2 in a certain type of aluminous cement is 5.5. To test whether the true average percentage is 5.5 for a particular production facility, 16 independently obtained samples are analyzed Suppose that the percentage of SiO2 in a sample is normally distributed with ơ=0.32 and that x̅=5.21. (Use α-0.05.) (a) Does this indicate conclusively that the true average percentage differs from 5.5? State the appropriate null and alternative hypotheses Calculate the test statistic and determine the P-value.State the...
3. A statistical program is recommended A random sample of soil specimens was obtained, and the...
 3. A statistical program is recommended A random sample of soil specimens was obtained, and the amount of organic matter (%) in the soil was determined for each specimen, resulting in the accompanying data, 1.16 5.09 0.97 1.59 4.60 0.32 0.55 1.45 0.10 4.47 1.20 3.50 5.02 4.67 5.22 2.69 3.98 3.17 3.03 2.21 0.69 4.47 3.31 1.17 0.76 1.17 1.57 2.62 1.66 2.05 The values of the sample mean, sample standard deviation, and (estimated) standard error of the mean...
Weatherwise is a magazine published by the American Meteorological Society. One issue gives a rating system...
Weatherwise is a magazine published by the American Meteorological Society. One issue gives a rating system used to classify Nor'easter storms that frequently hit New England and can cause much damage near the ocean. A severe storm has an average peak wave height of μ = 16.4 feet for waves hitting the shore. Suppose that a Nor'easter is in progress at the severe storm class rating. Peak wave heights are usually measured from land (using binoculars) off fixed cement piers....
aminate sheets under specified conditions was calculated as 5.81 695 A 95% CI for true average mount of war age mm o warpage is normally distributed. ased on a sample size and the as surm on that amo...
 aminate sheets under specified conditions was calculated as 5.81 695 A 95% CI for true average mount of war age mm o warpage is normally distributed. ased on a sample size and the as surm on that amount r n (a) Suppose you want to test H0: μ-7 versus Ha: μ 7 using α = 0.05. what conclusion would be appropriate, and why? since the null value o 7 is in the 95% confidence interval we re ect 0 There...
The drying time of a certain type of paint under specified test conditions is known to be normall...
The drying time of a certain type of paint under specified test conditions is known to be normally distributed with mean value 75 min and standard deviation 9 min. Chemists have proposed a new additive designed to decrease average drying time. It is believed that drying times with this additive will remain normally distributed with σ = 9. Because of the expense associated with the additive, evidence should strongly suggest an improvement in average drying time before such a conclusion...
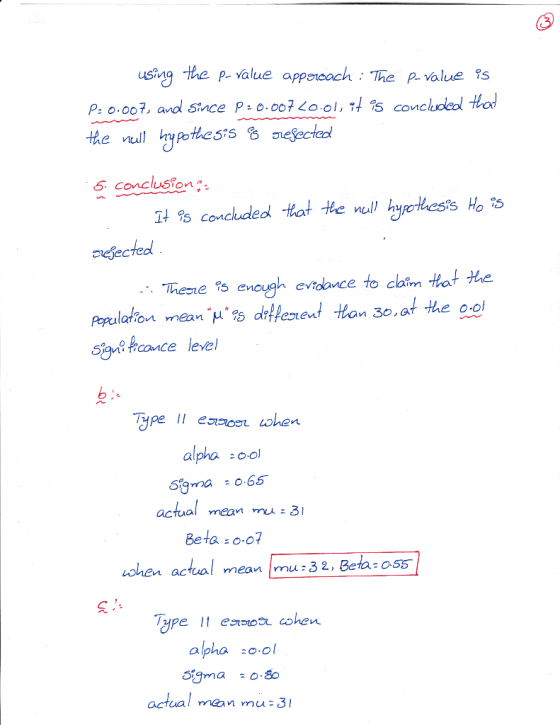
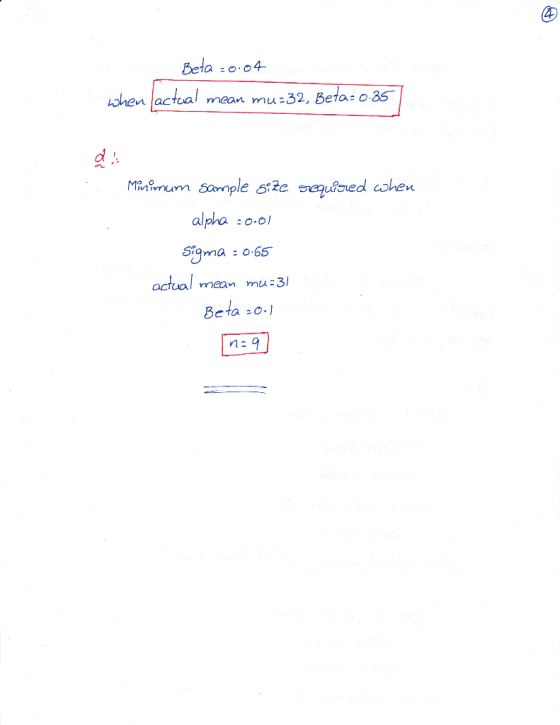
 The following observations are are on stopping distance (n) of a particular truck at 20 mph under specified experimental conditions. 32.1 30.9 314 30.4 31.0 31.9 opping distanoe is 30. A normal probability plot validates the assumption that stopping distance is normally distributed average stopping distance exceeds this maximum value? Test the appropriate hypotheses using a-.01 State the apprepriate hypotheses Оно: μ-30 He' μ * 30 Me: μ + 30 30 Ho: 30 calculate the test statistic and ermine the...
 Please help me get the right values, I cannot figure it out.
Please show your work.
A statistical program is recommended The following observations are on stopping distance (ft) of a particular truck at 20 mph under specified experimental conditions 32.1 30.8 31.7 30.4 31.0 31.9 The report states that under these conditions, the maximum alowable stopping distance is 30. A normal probability plot validates the assumption that stopping distance is normally distributecd. (a) Does the data suggest that true...
Please help me get the right values, I cannot figure it out.
Please show your work.
A statistical program is recommended The following observations are on stopping distance (ft) of a particular truck at 20 mph under specified experimental conditions 32.1 30.8 31.7 30.4 31.0 31.9 The report states that under these conditions, the maximum alowable stopping distance is 30. A normal probability plot validates the assumption that stopping distance is normally distributecd. (a) Does the data suggest that true...
 The desired percentage of SiO2 in a certain type of aluminous cement is 5.5. To test whether the true average percentage is 5.5 for a particular production facility, 16 independently obtained samples are analyzed. Suppose that the percentage of SiO2 in a sample is normally distributed with σ = 0.30 and that x= 5.23. (Use α-0.05.) (a) Does this indicate conclusively that the true average percentage differs from 5.5? State the appropriate null and alternative hypotheses Hai μ < 5.5...
 Consider the following random sample observations on stabilized viscosity of asphalt specimens. 2061 2099 1982 1842 2052 Suppose that for a particular application, it is required that true average viscosity be 2000. Is there evidence this requirement is not satisfied? From previous findings we know that the population standard deviation, σ State the appropriate hypotheses. (Use α-0.05.) 90.8 Ho: μ < 2000 Hai μ 2000 Ho: μ 2000 Ha: μ 2000 Ho: μ 2000 Hai μ-2000 Ho: μ > 2000...
 3. A statistical program is recommended A random sample of soil specimens was obtained, and the amount of organic matter (%) in the soil was determined for each specimen, resulting in the accompanying data, 1.16 5.09 0.97 1.59 4.60 0.32 0.55 1.45 0.10 4.47 1.20 3.50 5.02 4.67 5.22 2.69 3.98 3.17 3.03 2.21 0.69 4.47 3.31 1.17 0.76 1.17 1.57 2.62 1.66 2.05 The values of the sample mean, sample standard deviation, and (estimated) standard error of the mean...
 aminate sheets under specified conditions was calculated as 5.81 695 A 95% CI for true average mount of war age mm o warpage is normally distributed. ased on a sample size and the as surm on that amount r n (a) Suppose you want to test H0: μ-7 versus Ha: μ 7 using α = 0.05. what conclusion would be appropriate, and why? since the null value o 7 is in the 95% confidence interval we re ect 0 There...
Most questions answered within 3 hours.
-
Consider the quantum number sets listed below.
What is the name of the smallest element for...
asked 1 hour ago -
In python,write a function nameSet(first, last) that takes a
person's first and last names as input,...
asked 3 hours ago -
How do you think we should value management? Specifically how
might we try to determine MRPL...
asked 3 hours ago -
Suppose the Central Bank of Turkey starts to pay
interest on reserves. Under what circumstances this...
asked 3 hours ago -
For Bergson the concept of Being contains less reality than does
the concept of Becoming. True...
asked 4 hours ago -
What is the hydroxide ion concentration, [OH-], in a solution
with a hydronium ion concentration, [H3O+]...
asked 4 hours ago -
What species is the reducing agent in the following
equation?
Mg(s) + 2HCl (aq) --> MgCl2(aq)...
asked 4 hours ago -
A 50g ice cube is taken out of a freezer at 0 degrees Celsius
and put...
asked 6 hours ago -
How do ratios help you determine trends? What specific
information do managers look at? Is there...
asked 6 hours ago -
A wavelength of 514 nm is used to find an unknown diffraction
grating. If the separation...
asked 6 hours ago -
Use the central limit theorem to find the mean and standard
error of the mean of...
asked 7 hours ago -
You will be given a file that will contain averages for classes
which are divided into...
asked 7 hours ago