
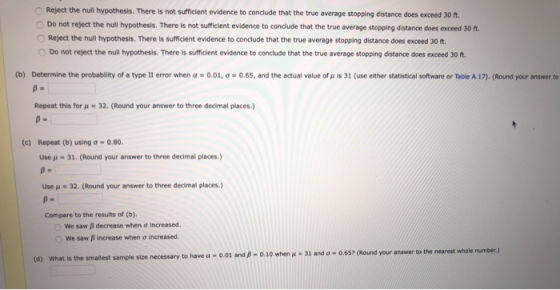
Reject the null hypothesis. There is not sufficient evidence to conclude that the true ODo not reject the null hypothesis. There is not sufficient evidence to conclude that the true a O Reject the null hypothesis. There is sufficient evidence to conclude that the true average stopping distance does exceed 30 ft. Do not reject the null hypothesis. There is sufficient evidence to conclude that the true average stopping distance does exceed 30 ft. (b) Determine the probability of a type Il error when a-0.01, σ = 0.65, and the actual value of μ is 31 (use either statistical software or Table A17) (Round your answer to Repeat this for μ-32. (Round your answer to three decimal places.) (c) Repeat (b) using σ-0.80. Use-31. (Round your answer to three decimal places.) Use μ-32. (Round your answer to three decimal places.) Compare to the results of (b). we saw β decrease when σ increased. we saw β increase when increased to the nearest whole number.) .10 when μ-31 and O-0.657(Round your answer what is the smallest sample size necessary to have a " 0.01 and β-0 (d)
Homework Answers


Add Answer to:
The following observations are are on stopping distance (n) of a particular truck at 20 mph under specified experimental conditions. 32.1 30.9 314 30.4 31.0 31.9 opping distanoe is 30. A normal...
A statistical program is recommended The following observations are on stopping distance (ft) of a particular truck at 20 mph under specified experimental conditions 32.1 30.7 31.4 30.4 31.0 31.9 The...
 A statistical program is recommended The following observations are on stopping distance (ft) of a particular truck at 20 mph under specified experimental conditions 32.1 30.7 31.4 30.4 31.0 31.9 The report states that under these conditions, the maximum allowable stopping distance is 30. A normal probability plot validates the assumption that stopping distance is normally distributed (a) Does the data suggest that true average stopping distance exceeds this maximum value? Test the appropriate hypotheses using α = 0.01 State...
Please help me get the right values, I cannot figure it out. Please show your work. A statistical program is recommended The following observations are on stopping distance (ft) of a particular truc...
 Please help me get the right values, I cannot figure it out.
Please show your work.
A statistical program is recommended The following observations are on stopping distance (ft) of a particular truck at 20 mph under specified experimental conditions 32.1 30.8 31.7 30.4 31.0 31.9 The report states that under these conditions, the maximum alowable stopping distance is 30. A normal probability plot validates the assumption that stopping distance is normally distributecd. (a) Does the data suggest that true...
Please help me get the right values, I cannot figure it out.
Please show your work.
A statistical program is recommended The following observations are on stopping distance (ft) of a particular truck at 20 mph under specified experimental conditions 32.1 30.8 31.7 30.4 31.0 31.9 The report states that under these conditions, the maximum alowable stopping distance is 30. A normal probability plot validates the assumption that stopping distance is normally distributecd. (a) Does the data suggest that true...
The desired percentage of SiO2 in a certain type of aluminous cement is 5.5. To test...
 The desired percentage of SiO2 in a certain type of aluminous cement is 5.5. To test whether the true average percentage is 5.5 for a particular production facility, 16 independently obtained samples are analyzed. Suppose that the percentage of SiO2 in a sample is normally distributed with σ = 0.30 and that x= 5.23. (Use α-0.05.) (a) Does this indicate conclusively that the true average percentage differs from 5.5? State the appropriate null and alternative hypotheses Hai μ < 5.5...
The desired percentage of SiO2 in a certain type of aluminous cement is 5.5. To test whether the ...
The desired percentage of SiO2 in a certain type of aluminous cement is 5.5. To test whether the true average percentage is 5.5 for a particular production facility, 16 independently obtained samples are analyzed. Suppose that the percentage of SiO2 in a sample is normally distributed with σ = 0.32 and that x = 5.22. (Use α = 0.05.) (a) Does this indicate conclusively that the true average percentage differs from 5.5? State the appropriate null and alternative hypotheses. H0:...
Consider the following random sample observations on stabilized viscosity of asphalt specimens. 2061 2099 1982 1842...
 Consider the following random sample observations on stabilized viscosity of asphalt specimens. 2061 2099 1982 1842 2052 Suppose that for a particular application, it is required that true average viscosity be 2000. Is there evidence this requirement is not satisfied? From previous findings we know that the population standard deviation, σ State the appropriate hypotheses. (Use α-0.05.) 90.8 Ho: μ < 2000 Hai μ 2000 Ho: μ 2000 Ha: μ 2000 Ho: μ 2000 Hai μ-2000 Ho: μ > 2000...
The desired percentage of Sio2 in a certain type of aluminous cement is 5.5
The desired percentage of Sio2 in a certain type of aluminous cement is 5.5. To test whether the true average percentage is 5.5 for a particular production facility, 16 independently obtained samples are analyzed Suppose that the percentage of SiO2 in a sample is normally distributed with ơ=0.32 and that x̅=5.21. (Use α-0.05.) (a) Does this indicate conclusively that the true average percentage differs from 5.5? State the appropriate null and alternative hypotheses Calculate the test statistic and determine the P-value.State the...
Consider a pa nt drying situation In which drying time or a test spec n-25 observations....
 Consider a pa nt drying situation In which drying time or a test spec n-25 observations. en Is normally distributed with o 6 TI e ypotheses 0: ·74 and μく are to be tested using aan om sample of (a) How many standard devlations (of X) below the null value is x 72.3? (Round your answer to two declmal places.) 1.42 standard deviations (b) If x = 72.3, what is the conclusion using α-0.0067 Calculate the test statistic and detrmine...
Consider the following sample observations on stabilized viscosity of asphalt specimens. 2755 2892 3013 2857 2887...
 Consider the following sample observations on stabilized viscosity of asphalt specimens. 2755 2892 3013 2857 2887 Suppose that for a particular application, it is required that true average viscosity be 3000. Does this requirement appear to have been satisfied? State the appropriate hypotheses. (Use a = 0.05.) Ho: > 3000 Hall < 3000 Ho: u < 3000 Hou = 3000 Ho: 4 = 3000 Ha: 4 = 3000 Hou = 3000 Ha: 4 = 3000 Calculate the test statistic and...
in a sample of n = 30 selected from a normal population, X=57 and S=20, what...
 in a sample of n = 30 selected from a normal population, X=57 and S=20, what is your statistical decision if the level of significance, a, is 0.10, the null hypothesis, Hois - 50, and the alternative hypothesis, Hy is 750? Click here to view page 1 of the table of the critical values of Click here to view page 2 of the table of the critical values of Determine the critical value(s) The critical value(s) is (are) (Round to...
Consider the following sample observations on stabilized viscosity of asphalt specimens. 2773 2901 2992 2826 2881...
 Consider the following sample observations on stabilized viscosity of asphalt specimens. 2773 2901 2992 2826 2881 Suppose that for a particular application, it is required that true average viscosity be 3000. Does this requirement appear to have been satisfied? State the appropriate hypotheses. (Use a = 0.05.) O Hoy > 3000 Ha: < 3000 Hou < 3000 Hall = 3000 Hou 3000 Họ: A = 3000 Hou = 3000 Hall 3000 By hand or using software calculate the sample mean...
 A statistical program is recommended The following observations are on stopping distance (ft) of a particular truck at 20 mph under specified experimental conditions 32.1 30.7 31.4 30.4 31.0 31.9 The report states that under these conditions, the maximum allowable stopping distance is 30. A normal probability plot validates the assumption that stopping distance is normally distributed (a) Does the data suggest that true average stopping distance exceeds this maximum value? Test the appropriate hypotheses using α = 0.01 State...
 Please help me get the right values, I cannot figure it out.
Please show your work.
A statistical program is recommended The following observations are on stopping distance (ft) of a particular truck at 20 mph under specified experimental conditions 32.1 30.8 31.7 30.4 31.0 31.9 The report states that under these conditions, the maximum alowable stopping distance is 30. A normal probability plot validates the assumption that stopping distance is normally distributecd. (a) Does the data suggest that true...
Please help me get the right values, I cannot figure it out.
Please show your work.
A statistical program is recommended The following observations are on stopping distance (ft) of a particular truck at 20 mph under specified experimental conditions 32.1 30.8 31.7 30.4 31.0 31.9 The report states that under these conditions, the maximum alowable stopping distance is 30. A normal probability plot validates the assumption that stopping distance is normally distributecd. (a) Does the data suggest that true...
 The desired percentage of SiO2 in a certain type of aluminous cement is 5.5. To test whether the true average percentage is 5.5 for a particular production facility, 16 independently obtained samples are analyzed. Suppose that the percentage of SiO2 in a sample is normally distributed with σ = 0.30 and that x= 5.23. (Use α-0.05.) (a) Does this indicate conclusively that the true average percentage differs from 5.5? State the appropriate null and alternative hypotheses Hai μ < 5.5...
 Consider the following random sample observations on stabilized viscosity of asphalt specimens. 2061 2099 1982 1842 2052 Suppose that for a particular application, it is required that true average viscosity be 2000. Is there evidence this requirement is not satisfied? From previous findings we know that the population standard deviation, σ State the appropriate hypotheses. (Use α-0.05.) 90.8 Ho: μ < 2000 Hai μ 2000 Ho: μ 2000 Ha: μ 2000 Ho: μ 2000 Hai μ-2000 Ho: μ > 2000...
 Consider a pa nt drying situation In which drying time or a test spec n-25 observations. en Is normally distributed with o 6 TI e ypotheses 0: ·74 and μく are to be tested using aan om sample of (a) How many standard devlations (of X) below the null value is x 72.3? (Round your answer to two declmal places.) 1.42 standard deviations (b) If x = 72.3, what is the conclusion using α-0.0067 Calculate the test statistic and detrmine...
 Consider the following sample observations on stabilized viscosity of asphalt specimens. 2755 2892 3013 2857 2887 Suppose that for a particular application, it is required that true average viscosity be 3000. Does this requirement appear to have been satisfied? State the appropriate hypotheses. (Use a = 0.05.) Ho: > 3000 Hall < 3000 Ho: u < 3000 Hou = 3000 Ho: 4 = 3000 Ha: 4 = 3000 Hou = 3000 Ha: 4 = 3000 Calculate the test statistic and...
 in a sample of n = 30 selected from a normal population, X=57 and S=20, what is your statistical decision if the level of significance, a, is 0.10, the null hypothesis, Hois - 50, and the alternative hypothesis, Hy is 750? Click here to view page 1 of the table of the critical values of Click here to view page 2 of the table of the critical values of Determine the critical value(s) The critical value(s) is (are) (Round to...
 Consider the following sample observations on stabilized viscosity of asphalt specimens. 2773 2901 2992 2826 2881 Suppose that for a particular application, it is required that true average viscosity be 3000. Does this requirement appear to have been satisfied? State the appropriate hypotheses. (Use a = 0.05.) O Hoy > 3000 Ha: < 3000 Hou < 3000 Hall = 3000 Hou 3000 Họ: A = 3000 Hou = 3000 Hall 3000 By hand or using software calculate the sample mean...
Most questions answered within 3 hours.
-
In python,write a function nameSet(first, last) that takes a
person's first and last names as input,...
asked 25 minutes ago -
How do you think we should value management? Specifically how
might we try to determine MRPL...
asked 17 minutes ago -
Suppose the Central Bank of Turkey starts to pay
interest on reserves. Under what circumstances this...
asked 27 minutes ago -
For Bergson the concept of Being contains less reality than does
the concept of Becoming. True...
asked 1 hour ago -
What is the hydroxide ion concentration, [OH-], in a solution
with a hydronium ion concentration, [H3O+]...
asked 1 hour ago -
What species is the reducing agent in the following
equation?
Mg(s) + 2HCl (aq) --> MgCl2(aq)...
asked 1 hour ago -
A 50g ice cube is taken out of a freezer at 0 degrees Celsius
and put...
asked 3 hours ago -
How do ratios help you determine trends? What specific
information do managers look at? Is there...
asked 3 hours ago -
A wavelength of 514 nm is used to find an unknown diffraction
grating. If the separation...
asked 3 hours ago -
Use the central limit theorem to find the mean and standard
error of the mean of...
asked 3 hours ago -
You will be given a file that will contain averages for classes
which are divided into...
asked 3 hours ago -
A Pew Research Center poll surveyed a random sample 850 voters
and asked them if they...
asked 3 hours ago