
Homework Answers
a)
b)
H0: µ1=µ2=-----=µn
H1: At least one pair of samples is significantly different
p-value<0.00001 (the result is significant)
Add Answer to:
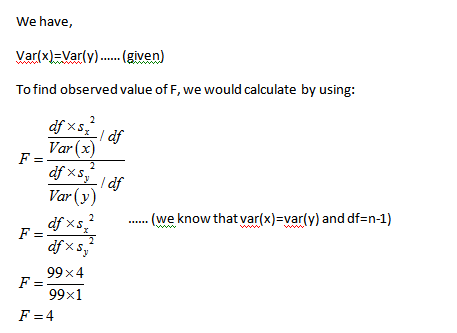
Question 2. Suppose (X.,X) . FXY, for i = 1, , n. We collect sample data for n-100, obtain sz-2 and Sy-1, and would like to test H0 : Var(x)-Var(y) versus HA : Var(z) Var(y). (a) Using the F test, wh...
All that I need to explain how we get 0.44725 in Part (f) (i) Obtain the expected values of X and Y E(X)-0.29; E(Y)-0.2...
 All that I need to explain how we get 0.44725 in Part (f)
(i) Obtain the expected values of X and Y E(X)-0.29; E(Y)-0.27 (ii) Obtain the variances of X and Y 2.2 . 10-4 Var(X) Var(Y) - 9.874 105 (d) Write down the test statistic for testing Ho: p1 p2 versus Ha: p1 p2 Test St = 2 where the "pooled" standard deviation is n+ n 2 with ơf-Var(X) and σ Var(Y) and nı'n, adjusted accordingly. (e) What is...
All that I need to explain how we get 0.44725 in Part (f)
(i) Obtain the expected values of X and Y E(X)-0.29; E(Y)-0.27 (ii) Obtain the variances of X and Y 2.2 . 10-4 Var(X) Var(Y) - 9.874 105 (d) Write down the test statistic for testing Ho: p1 p2 versus Ha: p1 p2 Test St = 2 where the "pooled" standard deviation is n+ n 2 with ơf-Var(X) and σ Var(Y) and nı'n, adjusted accordingly. (e) What is...
Suppose for the two exams in this course, we would like to see if there is any significant improvement from exam 1 to exam 2, i.e., testing H0 : µx ≥ µy vs HA : µx < µy for the average exam scores....
Suppose for the two exams in this course, we would like to see if there is any significant improvement from exam 1 to exam 2, i.e., testing H0 : µx ≥ µy vs HA : µx < µy for the average exam scores. Suppose we have n = 36 students, and the sample statistics are x¯ = 21, y¯ = 22, sx = sy = 3 and sxy = 4.5. Compute the p-value using paired two-sample test Suppose we use...
#1 part A.) To test H0: μ=100 versus H1: μ≠100, a random sample of size n=20...
#1 part A.) To test H0: μ=100 versus H1: μ≠100, a random sample of size n=20 is obtained from a population that is known to be normally distributed. Complete parts (a) through (d) below. (aa.) If x̅=104.4 and s=9.4, compute the test statistic. t0 = __________ (bb.) If the researcher decides to test this hypothesis at the α=0.01 level of significance, determine the critical value(s). Although technology or a t-distribution table can be used to find the critical value, in...
Suppose that X1, X2, . . . , Xn is an iid sample of N (0, σ2 ) observations, where σ 2 > 0 is unknown. Consider testing H0 : σ 2 = σ 2 0 versus H1 : σ 2 6= σ 2 0
 Suppose that X1, X2, . . . , Xn is an iid sample of N (0, σ2
) observations, where σ
2 > 0 is
unknown. Consider testing
H0 : σ
2 = σ
2
0 versus H1 : σ
2
6= σ
2
0
;
where σ
2
0
is known.
(a) Derive a size α likelihood ratio test of H0 versus H1. Your rejection region should
be written in terms of a sufficient statistic.
(b) When the null...
Suppose that X1, X2, . . . , Xn is an iid sample of N (0, σ2
) observations, where σ
2 > 0 is
unknown. Consider testing
H0 : σ
2 = σ
2
0 versus H1 : σ
2
6= σ
2
0
;
where σ
2
0
is known.
(a) Derive a size α likelihood ratio test of H0 versus H1. Your rejection region should
be written in terms of a sufficient statistic.
(b) When the null...
3. Let X,,X,,..., X, be a random sample from a Gamma 40distribution, where 6>0. we wish to test H0 : θ-1 vs. Hi : θ #1. Show that the likelihood ratio test statistic, A , can be written as A(V) wh...
 3. Let X,,X,,..., X, be a random sample from a Gamma 40distribution, where 6>0. we wish to test H0 : θ-1 vs. Hi : θ #1. Show that the likelihood ratio test statistic, A , can be written as A(V) where a. What is the distribution of V? what is the null distribution of what will be the rejection region for an α level test? b. 20 d.
3. Let X,,X,,..., X, be a random sample from a Gamma 40distribution,...
3. Let X,,X,,..., X, be a random sample from a Gamma 40distribution, where 6>0. we wish to test H0 : θ-1 vs. Hi : θ #1. Show that the likelihood ratio test statistic, A , can be written as A(V) where a. What is the distribution of V? what is the null distribution of what will be the rejection region for an α level test? b. 20 d.
3. Let X,,X,,..., X, be a random sample from a Gamma 40distribution,...
Suppose we would like to test H_0: μ x = μ y . Denote the unpaired...
Suppose we would like to test H_0: μ x = μ y . Denote the unpaired two-sample normalized test statistic as t 1 , and the ANOVA F test statistic as \\ t 2 . Suppose for given sample data of equal sample size, we get t 1 = 10 . Compute t 2 . Hint: For equal sample size, establish a relationship between unpaired two-sample test and ANOVA F test.
e. Consider the multiple regression model y X 3+E. with E(e)-0 and var (e) ơ21 Assume that ε ~ N(0 σ21), when we test the hypothesis Ho : βί-0 against Ha : βί 0 we use the t statistic with n-k-1 degr...
 e. Consider the multiple regression model y X 3+E. with E(e)-0 and var (e) ơ21 Assume that ε ~ N(0 σ21), when we test the hypothesis Ho : βί-0 against Ha : βί 0 we use the t statistic with n-k-1 degrees of freedom. When Ho is not true find the expected value and variance of the test onsider the genera -~ 0 gains 0 1S not true find the expected value and variance of the test statistic.
e. Consider...
e. Consider the multiple regression model y X 3+E. with E(e)-0 and var (e) ơ21 Assume that ε ~ N(0 σ21), when we test the hypothesis Ho : βί-0 against Ha : βί 0 we use the t statistic with n-k-1 degrees of freedom. When Ho is not true find the expected value and variance of the test onsider the genera -~ 0 gains 0 1S not true find the expected value and variance of the test statistic.
e. Consider...
2) If we now set H(x,y.t)-H0(x,y)+n(x,y,t) and assume that we only have small- amplitude motions with...
 2) If we now set H(x,y.t)-H0(x,y)+n(x,y,t) and assume that we only have small- amplitude motions with we obtain the linearized shallow-water equations Ot on O a) For the special non-rotating case (f -0 ) with constant depth (Ho - const.) show that the speed of gravity waves is c-VgHo Hint: set v-0 and derive a wave equation for the sea level η b) Given a harmonic wave η(x,t)=Asin(k-or) with amplitude A (again for f-0 and Ho= const.), derive the equation...
2. Suppose we observe the pairs (X, Y), i-1, , n and fit the simple linear regression (SLR) model...
 2. Suppose we observe the pairs (X, Y), i-1, , n and fit the simple linear regression (SLR) model Consider the test H0 : β,-0 vs. Ha : Aメ0. (a) What is the full model? Write the appropriate matrices Y and X. (b) What is the full model SSE? (c) What is the reduced model? Write the appropriate matrix XR. (d) What is the reduced model SSE? (e) Simplify the F statistics of the ANOVA test of Ho B10 vs....
Question 4. Suppose for i=1,...,n both the mean and variance are unknown. Based on n=100 sample...
Question 4. Suppose for i=1,...,n both the mean and variance are unknown. Based on n=100 sample data, we would like to test vs a) at a type 1 error level , find a sample statistic T and the rejection region R that correctly controls exactly, i.e., find T and R that satisfy (must be exact in distribution not approximate). b) Compute the asymptotic power of T, i.e., what does converge to as sample size goes to infinity? Question 5. Following...
 All that I need to explain how we get 0.44725 in Part (f)
(i) Obtain the expected values of X and Y E(X)-0.29; E(Y)-0.27 (ii) Obtain the variances of X and Y 2.2 . 10-4 Var(X) Var(Y) - 9.874 105 (d) Write down the test statistic for testing Ho: p1 p2 versus Ha: p1 p2 Test St = 2 where the "pooled" standard deviation is n+ n 2 with ơf-Var(X) and σ Var(Y) and nı'n, adjusted accordingly. (e) What is...
All that I need to explain how we get 0.44725 in Part (f)
(i) Obtain the expected values of X and Y E(X)-0.29; E(Y)-0.27 (ii) Obtain the variances of X and Y 2.2 . 10-4 Var(X) Var(Y) - 9.874 105 (d) Write down the test statistic for testing Ho: p1 p2 versus Ha: p1 p2 Test St = 2 where the "pooled" standard deviation is n+ n 2 with ơf-Var(X) and σ Var(Y) and nı'n, adjusted accordingly. (e) What is...
 3. Let X,,X,,..., X, be a random sample from a Gamma 40distribution, where 6>0. we wish to test H0 : θ-1 vs. Hi : θ #1. Show that the likelihood ratio test statistic, A , can be written as A(V) where a. What is the distribution of V? what is the null distribution of what will be the rejection region for an α level test? b. 20 d.
3. Let X,,X,,..., X, be a random sample from a Gamma 40distribution,...
3. Let X,,X,,..., X, be a random sample from a Gamma 40distribution, where 6>0. we wish to test H0 : θ-1 vs. Hi : θ #1. Show that the likelihood ratio test statistic, A , can be written as A(V) where a. What is the distribution of V? what is the null distribution of what will be the rejection region for an α level test? b. 20 d.
3. Let X,,X,,..., X, be a random sample from a Gamma 40distribution,...
 e. Consider the multiple regression model y X 3+E. with E(e)-0 and var (e) ơ21 Assume that ε ~ N(0 σ21), when we test the hypothesis Ho : βί-0 against Ha : βί 0 we use the t statistic with n-k-1 degrees of freedom. When Ho is not true find the expected value and variance of the test onsider the genera -~ 0 gains 0 1S not true find the expected value and variance of the test statistic.
e. Consider...
e. Consider the multiple regression model y X 3+E. with E(e)-0 and var (e) ơ21 Assume that ε ~ N(0 σ21), when we test the hypothesis Ho : βί-0 against Ha : βί 0 we use the t statistic with n-k-1 degrees of freedom. When Ho is not true find the expected value and variance of the test onsider the genera -~ 0 gains 0 1S not true find the expected value and variance of the test statistic.
e. Consider...
 2) If we now set H(x,y.t)-H0(x,y)+n(x,y,t) and assume that we only have small- amplitude motions with we obtain the linearized shallow-water equations Ot on O a) For the special non-rotating case (f -0 ) with constant depth (Ho - const.) show that the speed of gravity waves is c-VgHo Hint: set v-0 and derive a wave equation for the sea level η b) Given a harmonic wave η(x,t)=Asin(k-or) with amplitude A (again for f-0 and Ho= const.), derive the equation...
 2. Suppose we observe the pairs (X, Y), i-1, , n and fit the simple linear regression (SLR) model Consider the test H0 : β,-0 vs. Ha : Aメ0. (a) What is the full model? Write the appropriate matrices Y and X. (b) What is the full model SSE? (c) What is the reduced model? Write the appropriate matrix XR. (d) What is the reduced model SSE? (e) Simplify the F statistics of the ANOVA test of Ho B10 vs....
Most questions answered within 3 hours.
-
On January 1, 2017, Nicks Corporation issued $250 million of
floating-rate debt. The debt carries a...
asked 27 minutes ago -
If Mark is unable to see objects clearly when they are placed
beyond 0.5m away, (a)...
asked 24 minutes ago -
Where there is no course of performance, usage of trade, or
course of dealing, and where...
asked 26 minutes ago -
A piece of charcoal (essentially 100% carbon) from an
archaeological site in Egypt is subjected to...
asked 41 minutes ago -
7) A) Balance the following reaction:
__H2SO4 + __NaOH __Na2SO4 + __H2O
b) Classify the...
asked 43 minutes ago -
Planets X, Y, and Z have circular orbits around a Star, which is
similar to our...
asked 52 minutes ago -
Use case analysis is used to ____
a) communicate system requirements
b) implement the system
c)...
asked 50 minutes ago -
What is the equilibrium constant for the reaction below, given
the listed concentrations at equilibrium? Report...
asked 53 minutes ago -
The following account appears in the ledger prior to recognizing
the jobs completed in August:
Work...
asked 54 minutes ago -
Air contained in a piston-cylinder undergoes two processes in
series. In the first the air expands...
asked 59 minutes ago -
Propose a circuit that has an effective resistance of 6666ohms.
Include drawing.
asked 1 hour ago -
Starting with a given fatty acid: C22:6 w-3 go through the
process of beta oxidation. begin...
asked 1 hour ago