The data given below gives annual income (
The data given below gives annual income (
Homework Answers
Solution:
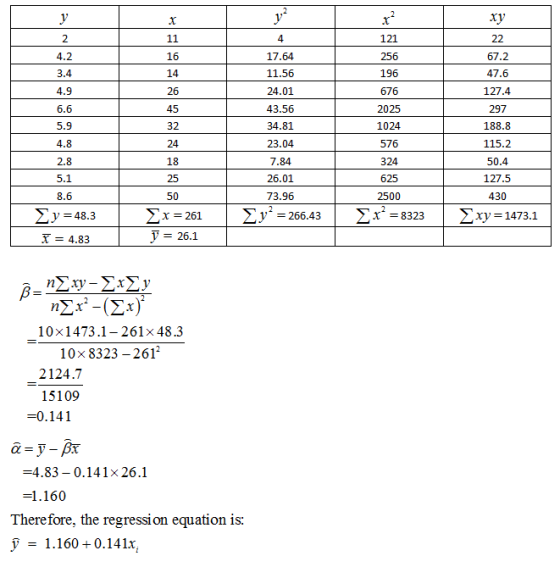
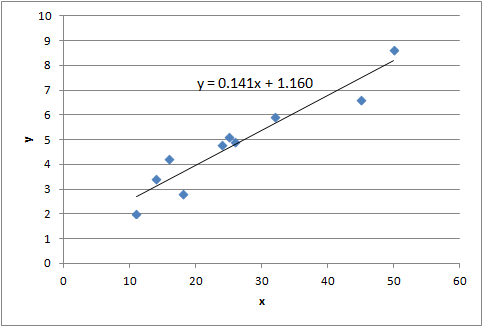
The slope of the regression equation (0.141) is interpreted as for 1000 dollars increase in annual family income, the expenditure on entertainment and recreation is expected to increase by 141 dollars.
The intercept of the regression equation (1.160) is interpreted the expected value of the expenditure on entertainment and recreation is 1160 dollars when annual family income is 0.
Consider the riding mower data with three variables as follows: ncome Annual income in $1000 Lot ...
 Consider the riding mower data with three variables as follows: ncome Annual income in $1000 Lot size Size of the lot in 1000 square feet Owner-Owner of riding mower or not a owner Suppose that the following is the logit function for the data with the variable Owner the target and the other two variables predictors. L--24.1+0.12 Income +1.35 Lot Size Consider a new homeowner with the predictor profile of $54600 of annual income and a lot size of 11500...
2 p Question 2 The following table gives annual interest rates for the given maturities. Assume...
 2 p Question 2 The following table gives annual interest rates for the given maturities. Assume that the pure expectations hypothesis holds. 1 Year|2.23% 2 Year|2.45% 3 Year!2.75% 4 Year! 2.83% 5 Year|3.29% What is the 2 year annual rate in 3 years? Question 3
Question 2 (2 points) The data below gives the number of pages, x, and the cost,...
 Question 2 (2 points) The data below gives the number of pages, x, and the cost, y, for a sample of six textbooks. Note that the data given in this problem is not necessarily the same as in the other problems. Find the equation of the regression line, y = a + bx, and correlation coefficient r for the data. Round all values to the nearest thousandth (to three decimal places). #pages, 1889416614 633 500 577 Cost, $189 S112 S152...
The data given below were taken from the income statements of Metronix Corporation. EEB Click the...
 The data given below were taken from the income statements of Metronix Corporation. EEB Click the icon to view the financial data for Metronix Corporation Compute the inventory-turnover ratio for each year. The inventory-turnover ratio in 2017 is times. (Round to one decimal place.)
Given the following data, answer the questions below the table: -------------------------------------------------------------------------------------------------------------------------------- Data Deluxe Tourist Annual sales...
Given the following data, answer the questions below the table: -------------------------------------------------------------------------------------------------------------------------------- Data Deluxe Tourist Annual sales in units 2,000 10,000 Direct materials per unit $25 $17 Direct labor-hours per unit 5 4 Direct labor rate $12 per DLH Estimated Overhead Expected Activity Activities and Activity Measures Cost Deluxe Tourist Total Labor related (direct labor-hours) $ 80,000 10,000 40,000 50,000 Machine setups (setups) 150,000 3,000 2,000 5,000 Production orders (orders) 70,000 230 270 500 General factory (machine-hours) 250,000 12,000 28,000 40,000...
this all the information given...plug in data(toothgrowth) into rstudio.cloud 2. The ToothGrowth dataset in R gives...
 this all the information given...plug in data(toothgrowth) into
rstudio.cloud
2. The ToothGrowth dataset in R gives information about the effect of Vitamin C on tooth grown in Guinea Pigs. (Use the command ? ToothGrowth for more information on the data and each individual variable.) Load this data into R using the command data("ToothGrowth"). a. Create boxplots of the guinea pigs' tooth length by the factor levels for supplement type and dosage. Be sure to include an appropriate title and axis...
this all the information given...plug in data(toothgrowth) into
rstudio.cloud
2. The ToothGrowth dataset in R gives information about the effect of Vitamin C on tooth grown in Guinea Pigs. (Use the command ? ToothGrowth for more information on the data and each individual variable.) Load this data into R using the command data("ToothGrowth"). a. Create boxplots of the guinea pigs' tooth length by the factor levels for supplement type and dosage. Be sure to include an appropriate title and axis...
Question 3 (14 points) The table below gives data about the number of labour units required...
 Question 3 (14 points) The table below gives data about the number of labour units required for a firm to produce certain quantities of output a) Complete the following table by calculating marginal product and average product from the data given. Inputs of Labour Total Product Marginal Product Average Product 128 213 284 315 0 b) Graph all your answers for marginal product and average product on the graph below. Select the curve you wish to graph from the drop-down...
Given the following, calculate the GDS ratio. All income and expense items are annual. Gross income...
Given the following, calculate the GDS ratio. All income and expense items are annual. Gross income $55,000 Bank account $1,000 Net income $38,000 Property taxes $3,600 Heating $4,800 Annual car payment $4,200 Credit card balance $2,500 Car loan balance $10,000 Student loan payments $2,400 Mortgage payments $15,600
We have data (given Below) that shows, the annual sales for four different companies (called company...
We have data (given Below) that shows, the annual sales for four different companies (called company A, B, C and D) for duration of 2000-2010 years. Make two scatter plot for each company's annual sales. In first scatter plot show Linear regression, display its equations and the R-square value. And in the second scatter plot show Exponential Regression, display its equation and the R-square value. For each company answer which regression (linear or exponential) is a better fit for the...
 Consider the riding mower data with three variables as follows: ncome Annual income in $1000 Lot size Size of the lot in 1000 square feet Owner-Owner of riding mower or not a owner Suppose that the following is the logit function for the data with the variable Owner the target and the other two variables predictors. L--24.1+0.12 Income +1.35 Lot Size Consider a new homeowner with the predictor profile of $54600 of annual income and a lot size of 11500...
 2 p Question 2 The following table gives annual interest rates for the given maturities. Assume that the pure expectations hypothesis holds. 1 Year|2.23% 2 Year|2.45% 3 Year!2.75% 4 Year! 2.83% 5 Year|3.29% What is the 2 year annual rate in 3 years? Question 3
 Question 2 (2 points) The data below gives the number of pages, x, and the cost, y, for a sample of six textbooks. Note that the data given in this problem is not necessarily the same as in the other problems. Find the equation of the regression line, y = a + bx, and correlation coefficient r for the data. Round all values to the nearest thousandth (to three decimal places). #pages, 1889416614 633 500 577 Cost, $189 S112 S152...
 The data given below were taken from the income statements of Metronix Corporation. EEB Click the icon to view the financial data for Metronix Corporation Compute the inventory-turnover ratio for each year. The inventory-turnover ratio in 2017 is times. (Round to one decimal place.)
 this all the information given...plug in data(toothgrowth) into
rstudio.cloud
2. The ToothGrowth dataset in R gives information about the effect of Vitamin C on tooth grown in Guinea Pigs. (Use the command ? ToothGrowth for more information on the data and each individual variable.) Load this data into R using the command data("ToothGrowth"). a. Create boxplots of the guinea pigs' tooth length by the factor levels for supplement type and dosage. Be sure to include an appropriate title and axis...
this all the information given...plug in data(toothgrowth) into
rstudio.cloud
2. The ToothGrowth dataset in R gives information about the effect of Vitamin C on tooth grown in Guinea Pigs. (Use the command ? ToothGrowth for more information on the data and each individual variable.) Load this data into R using the command data("ToothGrowth"). a. Create boxplots of the guinea pigs' tooth length by the factor levels for supplement type and dosage. Be sure to include an appropriate title and axis...
 Question 3 (14 points) The table below gives data about the number of labour units required for a firm to produce certain quantities of output a) Complete the following table by calculating marginal product and average product from the data given. Inputs of Labour Total Product Marginal Product Average Product 128 213 284 315 0 b) Graph all your answers for marginal product and average product on the graph below. Select the curve you wish to graph from the drop-down...
Most questions answered within 3 hours.
-
You working as a clinical engineer dealing with
autoclaves, xrays and life care machines, in what...
asked 1 minute ago -
Explain in detail (not just enumerate) each of Koch’s
postulates to determine the etiology of a...
asked 13 minutes ago -
Assume ABC Company has asked you to not only prepare their 2017
year-end Balance Sheet but...
asked 10 minutes ago -
You have just had a new set of tires put on your car, and now
the...
asked 16 minutes ago -
Please answer ASAP 2) Choose a point at random from the unit
square [0, 1] ×...
asked 30 minutes ago -
Draw the Lewis structures and determine which of these
molecules has a central atom that unavoidably...
asked 31 minutes ago -
Do we typically carry antibodies against the RH antigen in our
blood plasma?
asked 33 minutes ago -
What are the differences between an antibiotic, a semisynthetic,
and a synthetic as types of antimicrobials?
asked 29 minutes ago -
One mole of oxygen gas is at a pressure of 5.90 atm and a
temperature of...
asked 37 minutes ago -
The primary side of a transformer has 935 turns and is connected
to 118 Volts A/C....
asked 35 minutes ago -
This must be done in Java and it must contain a public static
void (string []args)...
asked 39 minutes ago -
An economy has a Cobb–Douglas production function:
Y=Kα(LE)1−αY=Kα(LE)1−α
The economy has a capital share of 0.30,...
asked 53 minutes ago