![QUESTION 3 [20M] Given the data below, where x is the number of hours playing online game, y is the students class test mark](http://img.homeworklib.com/images/a3d13ecf-70b8-4e28-ac7c-44bacc9414c3.png?x-oss-process=image/resize,w_560)
Homework Answers
Answer #1
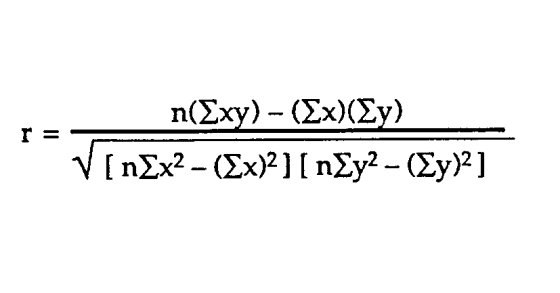
a) 1.pearson product-moment correlation coefficient
2.Spearman's rank correlation coefficient.
b)We use 1 pearson correlation coefficient because we want to see linear linearship between variable X and variable Y.
c)I computed correlation coefficient using EXCEL.
1=> Enter the data in excel spreadsheet as given in omage below.
2=> use the formulae,
=Corr(array1,array2)
output is on screen.
 d)
Now we draw scatter plot using excel.
d)
Now we draw scatter plot using excel.
1=> Enter data in excel as given above.
2=> go to insert option and click on SCATTER
and select type and click ok then output is on screen.
e) r= -0.69404
There is a strong downhill (negative) linear relationship.
We were unable to transcribe this image
E Wrap Text Calibri Paste JFormat Painter B 1 u.田-3". A- 퓰 를ǐ 惘曌Merge & Center, S. % , 1-28 Conditional For A. İ 퓰퓰 镡 섬 Merge & Center▼ $ ▼ % ,1/508ml Conditional Forr Formatting as Tal Styles E Copy Number Alignment Font Clipboard し18 variable 1 student 90 80 70 60 50 40 2 20 25 50 45 40 10 12 variable x variable y Linear (variable x) Linear (variable y) 7 2 20 10 10 0.69404 12 13 14 8 6 16 17 18 19 21 23 24 Sheeti Sheet? Sheet?
Know the answer?
Add Answer to:
QUESTION 3 [20M] Given the data below, where x is the number of hours playing online game, y is the student's class test marks Student Variable 10 20 12 40 80 60 50 a) Name the two most popula...
Not the answer you're looking for?
Ask your own homework help question.
Our experts will answer your question WITHIN MINUTES for Free.
Similar Homework Help Questions
ADVERTISEMENT
Need Online Homework Help?
Ask
a QuestionGet Answers For Free
Most questions answered within 3 hours.
Most questions answered within 3 hours.
ADVERTISEMENT
ADVERTISEMENT
Active Questions
-
A horizontal mass of M=5kg is on a spring and stretched to
x=0.5m when released from...
asked 1 hour ago -
26 of 50
"I have worked at the Arizona Humane Society for ten years, and
have...
asked 1 hour ago -
Compare and contrast zero based budgeting and incremental (or
base year) budgeting.
asked 1 hour ago -
4 pts 10. Which of the following hypothesis would be MOST
difficult to test experimentally? Group...
asked 1 hour ago -
A business owner makes 1,000 items a day. Each day he or she
contributes eight hours...
asked 1 hour ago -
A
circular loop in the plane of a paper lies inca0.65 T magnetic
field pointing into...
asked 1 hour ago -
A business owner is trying to decide whether to buy, rent, or
lease office space and...
asked 1 hour ago -
Thermal Storage Solar heating of a house is much more efficient
if there is a way...
asked 2 hours ago -
Considering the “fits” for group and job design dimensions,
suppose you had 12 employees with different...
asked 2 hours ago -
Consider TCP connection management.
How many segments are typically involved in the TCP connection
establishment? What...
asked 2 hours ago -
1. You placed a stop-loss order to sell 500 shares of AAPL with
a stop price...
asked 2 hours ago -
Sylva Warehousing desired to locate a central warehouse to serve
five North Carolina markets. Placed on...
asked 2 hours ago
ADVERTISEMENT