how do i solve these in excel?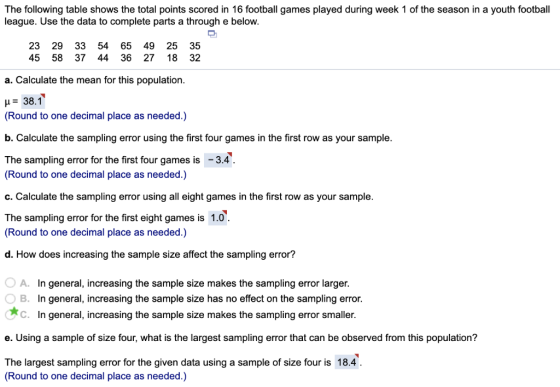
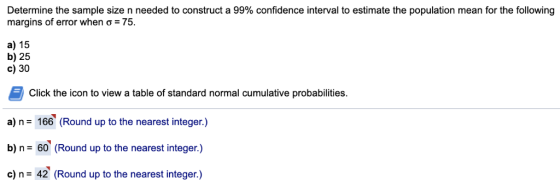


Determine the sample size n needed to construct a 99% confidence interval to estimate the population mean for the following margins of error when σ-75. a) 15 b) 25 c) 30 Click the icon to view a table of standard normal cumulative probabilities a) n- 166 (Round up to the nearest integer.) b) n- 60 (Round up to the nearest integer.) c) n42 (Round up to the nearest integer.)
A university would like to estimate the proportion of fans who purchase concessions at the first basketball game of the season. The basketball facility has a capacity of 3,500 and is routinely sold out. It was discovered that a total of 200 fans out of a random sample of 500 purchased concessions during the game. Construct a 95% confidence interval to estimate the proportion of fans who purchased concessions during the game The 95% confidence interval to estimate the proportion of fans who purchased concessions during the game is 0.360 0.440
For a population with a mean equal to 150 and a standard deviation equal to 25, calculate the standard error of the mean for the following sample sizes. a) 10 b) 30 c) 50 a) The standard error of the mean for a sample size of 10 is 7.91. Round to two decimal places as needed.) 6 b) The standard error of the mean for a sample size of 30 is 4.56 Round to two decimal places as needed.) c) The standard error of the mean for a sample size of 50 is 3.54 Round to two decimal places as needed.)
Homework Answers
Mean value is calculated by

Where X = given data values
n = number of data
Here mean

= 610/16
= 38.125
= 38.1
b) sampling error for first 4 games mean of first four games is

= 139/4
= 34.75
= 34.7
Sampling error = 

. = 34.7- 38.1
= - 3.4
c) considering first 8 games in the first row

= 39.125
= 39.1
Sampling error = 39.1- 38.1
= 1.0
d) we know that in general increasing the sample size makes the sampling error smaller .Hence answer is C
e) largest sampling error that a 4 group sample can produce is with largest sample mean .In order to get largest sample mean use large sample values hence taking 4 large sample
65 , 58 , 54 , 49

= 226/4
= 56.5
Largest sampling error = 56.5- 38.1
= 18.4
We know margin error can be calculated as
ME = 
t* = 2.576 because given 99% interval
n = sample size

= 75
a). ME = 15

= 2.576×75 /15
= 12.88
n = 12.882
=165.89
= 166
b). ME = 25

= 7.728
n = 7.7282
= 59.7
= 60
c) . ME = 30

= 6.44
n = 6.442
= 41.5
= 42
Add Answer to:
how do i solve these in excel? The following table shows the total points scored in 16 football games played during week 1 of the season in a youth football league. Use the data to complete parts a th...
A random sample of 16 college men's basketball games during the last season had an average...
A random sample of 16 college men's basketball games during the last season had an average attendance of 5,062 with a sample standard deviation of 1,757. Complete parts a and b below. a. Construct a 95% confidence interval to estimate the average attendance of a college men's basketball game during the last season.The 95% confidence interval to estimate the average attendance of a college men's basketball game during the last season is from a lower limit of ______ to an...
I need help. PLEASE DONT USE THE STANDARD NORMAL DISTRIBUTION TABLE. use normalcdf as part of...
 I need help. PLEASE DONT USE THE STANDARD NORMAL
DISTRIBUTION TABLE. use normalcdf as part of your answer.
Thank you
8.2.11 10,000 and whose population proportion with a specified characteristic is p=0.6. Suppose a simple random sample of size n = 200 is obtained from a population whose size is N (a) Describe the sampling distribution of p. Choose the phrase that best describes the shape of the sampling distribution below. A. Not normal because ns0.05N and np(1-P) < 10....
I need help. PLEASE DONT USE THE STANDARD NORMAL
DISTRIBUTION TABLE. use normalcdf as part of your answer.
Thank you
8.2.11 10,000 and whose population proportion with a specified characteristic is p=0.6. Suppose a simple random sample of size n = 200 is obtained from a population whose size is N (a) Describe the sampling distribution of p. Choose the phrase that best describes the shape of the sampling distribution below. A. Not normal because ns0.05N and np(1-P) < 10....
14. A cellphone provider has the business objective of wanting to estimate the proportion of subscribers...
 14. A cellphone provider has the business objective of wanting to estimate the proportion of subscribers who would upgrade to a new cellphone with improved features if it were made available at a substantially reduced cost. Data are collected from a random sample of 500 subscribers. The results indicate that 130 of the subscribers would upgrade to a new cellphone at a reduced cost. Complete parts (a) and (b) below. a. Construct a 95% confidence interval estimate for the population...
can i get help answering these questions please i do not understand how to solve them...
 can i get help answering these questions please i do not
understand how to solve them im having trouble please.
Question Hop The brand manager for a brand of toothpaste must plan a campaign designed to increase brand recognition. He wants to first determine the percentage of adults who have heard of the brand. How many adults must he survey in order to be 90% confident that his estimate is within seven percentage points of the true population percentage? Complete...
can i get help answering these questions please i do not
understand how to solve them im having trouble please.
Question Hop The brand manager for a brand of toothpaste must plan a campaign designed to increase brand recognition. He wants to first determine the percentage of adults who have heard of the brand. How many adults must he survey in order to be 90% confident that his estimate is within seven percentage points of the true population percentage? Complete...
can someone help me all these questions please. i kind if forgot step to step how...
 can someone help me all these questions please. i kind if
forgot step to step how to solve this may someone help me solve
these questions.
Question Help Library An engineer is going to redesign an ejection seat for an airplane. The seat was designed for pilots weighing between 130 lb and 171 lb. The new population of pilots has normally distributed weights with a mean of 139 lb and a standard deviation of 29.7 ib. a. If a pilot...
can someone help me all these questions please. i kind if
forgot step to step how to solve this may someone help me solve
these questions.
Question Help Library An engineer is going to redesign an ejection seat for an airplane. The seat was designed for pilots weighing between 130 lb and 171 lb. The new population of pilots has normally distributed weights with a mean of 139 lb and a standard deviation of 29.7 ib. a. If a pilot...
You roll a six-sided die. Find the probability of each of the following scenarios. (a) Rolling...
 You roll a six-sided die. Find the probability of each of the following scenarios. (a) Rolling a 6 or a number greater than 3 (b) Rolling a number less than 4 or an even number (c) Rolling a 4 or an odd number (a) P(6 or number> 3)- (Round to three decimal places as needed) (b) P/1 or 2 or 3 or 4 or 6)-( Round to three decimal places as needed.) (c) P(4 or 1 or 3 or 5)...
photos for each question are all in a row (1 point) In the following questions, use...
 photos for each question are all in a row
(1 point) In the following questions, use the normal distribution to find a confidence interval for a difference in proportions pu - P2 given the relevant sample results. Give the best point estimate for p. - P2, the margin of error, and the confidence interval. Assume the results come from random samples. Give your answers to 4 decimal places. 300. Use 1. A 80% interval for pı - P2 given that...
photos for each question are all in a row
(1 point) In the following questions, use the normal distribution to find a confidence interval for a difference in proportions pu - P2 given the relevant sample results. Give the best point estimate for p. - P2, the margin of error, and the confidence interval. Assume the results come from random samples. Give your answers to 4 decimal places. 300. Use 1. A 80% interval for pı - P2 given that...
 I need help. PLEASE DONT USE THE STANDARD NORMAL
DISTRIBUTION TABLE. use normalcdf as part of your answer.
Thank you
8.2.11 10,000 and whose population proportion with a specified characteristic is p=0.6. Suppose a simple random sample of size n = 200 is obtained from a population whose size is N (a) Describe the sampling distribution of p. Choose the phrase that best describes the shape of the sampling distribution below. A. Not normal because ns0.05N and np(1-P) < 10....
I need help. PLEASE DONT USE THE STANDARD NORMAL
DISTRIBUTION TABLE. use normalcdf as part of your answer.
Thank you
8.2.11 10,000 and whose population proportion with a specified characteristic is p=0.6. Suppose a simple random sample of size n = 200 is obtained from a population whose size is N (a) Describe the sampling distribution of p. Choose the phrase that best describes the shape of the sampling distribution below. A. Not normal because ns0.05N and np(1-P) < 10....
 14. A cellphone provider has the business objective of wanting to estimate the proportion of subscribers who would upgrade to a new cellphone with improved features if it were made available at a substantially reduced cost. Data are collected from a random sample of 500 subscribers. The results indicate that 130 of the subscribers would upgrade to a new cellphone at a reduced cost. Complete parts (a) and (b) below. a. Construct a 95% confidence interval estimate for the population...
 can i get help answering these questions please i do not
understand how to solve them im having trouble please.
Question Hop The brand manager for a brand of toothpaste must plan a campaign designed to increase brand recognition. He wants to first determine the percentage of adults who have heard of the brand. How many adults must he survey in order to be 90% confident that his estimate is within seven percentage points of the true population percentage? Complete...
can i get help answering these questions please i do not
understand how to solve them im having trouble please.
Question Hop The brand manager for a brand of toothpaste must plan a campaign designed to increase brand recognition. He wants to first determine the percentage of adults who have heard of the brand. How many adults must he survey in order to be 90% confident that his estimate is within seven percentage points of the true population percentage? Complete...
 can someone help me all these questions please. i kind if
forgot step to step how to solve this may someone help me solve
these questions.
Question Help Library An engineer is going to redesign an ejection seat for an airplane. The seat was designed for pilots weighing between 130 lb and 171 lb. The new population of pilots has normally distributed weights with a mean of 139 lb and a standard deviation of 29.7 ib. a. If a pilot...
can someone help me all these questions please. i kind if
forgot step to step how to solve this may someone help me solve
these questions.
Question Help Library An engineer is going to redesign an ejection seat for an airplane. The seat was designed for pilots weighing between 130 lb and 171 lb. The new population of pilots has normally distributed weights with a mean of 139 lb and a standard deviation of 29.7 ib. a. If a pilot...
 You roll a six-sided die. Find the probability of each of the following scenarios. (a) Rolling a 6 or a number greater than 3 (b) Rolling a number less than 4 or an even number (c) Rolling a 4 or an odd number (a) P(6 or number> 3)- (Round to three decimal places as needed) (b) P/1 or 2 or 3 or 4 or 6)-( Round to three decimal places as needed.) (c) P(4 or 1 or 3 or 5)...
 photos for each question are all in a row
(1 point) In the following questions, use the normal distribution to find a confidence interval for a difference in proportions pu - P2 given the relevant sample results. Give the best point estimate for p. - P2, the margin of error, and the confidence interval. Assume the results come from random samples. Give your answers to 4 decimal places. 300. Use 1. A 80% interval for pı - P2 given that...
photos for each question are all in a row
(1 point) In the following questions, use the normal distribution to find a confidence interval for a difference in proportions pu - P2 given the relevant sample results. Give the best point estimate for p. - P2, the margin of error, and the confidence interval. Assume the results come from random samples. Give your answers to 4 decimal places. 300. Use 1. A 80% interval for pı - P2 given that...
Most questions answered within 3 hours.
-
Write a program that reads in a text file, infile.txt, and
prints out all the lines...
asked 19 minutes ago -
Which of the following orbits have a total of zero energy (based
on the common convention)?...
asked 27 minutes ago -
Find the expected count and the contribution to the chi-square
statistic for the (Group 1, No)...
asked 1 hour ago -
Suppose you are purchasing a meal and with every meal a you
receive one of 10...
asked 1 hour ago -
A 75.0 kg 0erson is riding in a car moving at 20.0 m/s when the
car...
asked 1 hour ago -
What does Δp = QR mean in words?
Pushing a viscous fluid through a pipe requires...
asked 1 hour ago -
We know that system.out.println (“object number” + n ); is
legal.String name; int n; name =...
asked 1 hour ago -
Come up with a real-life problem (open-ended) and solve it by
designing and writing a Java...
asked 2 hours ago -
Power Music owns five music stores, where it sells music,
instruments, and supplies. In addition, it...
asked 2 hours ago -
True or false and
why:
Given the following sequence of numbers to be
inserted {4,5,6,1,2,3,8,7}, the...
asked 2 hours ago -
Code using Java
What is an interface? Complete the following code:
interface IExample{
public void print();...
asked 2 hours ago -
Bob Nale is the owner of Nale’s Quick Fill. Bob would like to
estimate the mean...
asked 2 hours ago