Use Excel Functions and show which functions you used. You may take screenshots.
Homework Answers
.

.
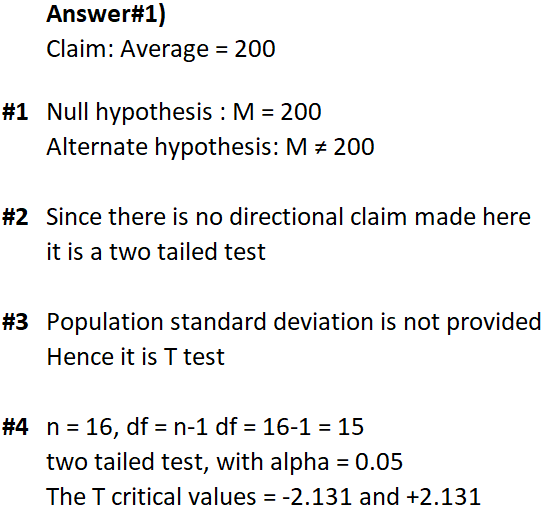
#5)
The sample mean ( X bar ) = 195
Sample standard deviation ( Sd) = 5.046
n = 16
M = 200
Test statistic :
t= (X bar - M) / (Sd / sqrt(n))
t = (195 -200)/(5.046/sqrt(16)
t = -3.9635
.
#6)
The formula of P value is:
df = 16-1 = 15
Two tailed test test
t = -3.9635
use excel function: =t.dist.2t(3.9635,15)
P value = 0.001249
.
#7)
Decision rule:
P value < alpha, reject the null hypothesis
We got P value 0.001249 < alpha 0.05 , hence reject the null hypothesis
.
#8)
Conclusion: Since the P value < alpha , and the T statistic -3.9635 lies in the rejection region ( < -2.131) , hence one concludes to reject the null hypothesis, which would imply that there is significant evidence to conclude that the mean is not equal to 200 and hence the initial claim made that mean is 200 is not supported by this sample data
.
#9)
Formula of confidence interval is:
x bar - t * Sd/ sqrt( n) , X bar + t * Sd / sqrt(n)
195 -2.131 * 5.046/sqrt(16) , 165 +2.131 *5.046/sqrt(16)
(192.3117 , 197.6883)
Add Answer to:
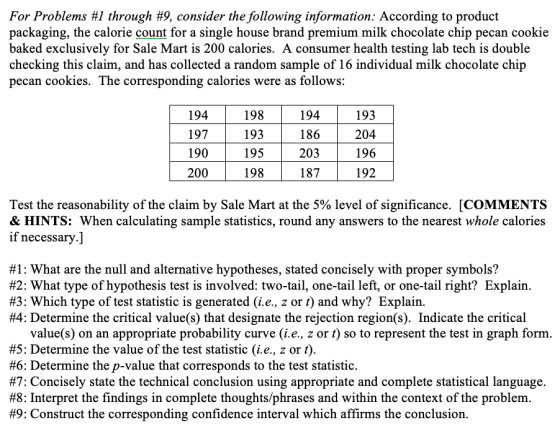
Use Excel Functions and show which functions you used. You may take screenshots. For Problems #1 through #9, consider the following information: According to product packaging, the calorie count for...
NAME: 1of 1 Solve the following problems and answer the following questions. Justify your solutio...
 please use EXCEL preferably
NAME: 1of 1 Solve the following problems and answer the following questions. Justify your solutions and answers with verbal and/or quantitative explanations in order to receive full credit. Even if working as a group, each group member must still submit her or his own copy of the solutions as documentation. Using appropriate technology to expedite these calculations is expected; however, such work must be fully documented or explained. Software printouts or spreadsheet copies should include your...
please use EXCEL preferably
NAME: 1of 1 Solve the following problems and answer the following questions. Justify your solutions and answers with verbal and/or quantitative explanations in order to receive full credit. Even if working as a group, each group member must still submit her or his own copy of the solutions as documentation. Using appropriate technology to expedite these calculations is expected; however, such work must be fully documented or explained. Software printouts or spreadsheet copies should include your...
Most questions answered within 3 hours.
-
Problem 1: Present entries to record the selected transactions
described below:
(a)
Issued $2,790,000 of 5-year,...
asked 4 minutes ago -
Using technology to support HR activities increases:
a.
the efficiency of the administrative HR functions.
b....
asked 5 minutes ago -
1. List the features used to classify leaf
types.
2. List some characteristics that are shared...
asked 10 minutes ago -
The three elements of Value Proposition, Key Customers, and
Capabilities operate within an environment. Which of...
asked 12 minutes ago -
Katelynn, a physician, earns $200,000 from her medical practice
in the current year. She receives $45,000...
asked 20 minutes ago -
Each row of the table below describes an aqueous solution at
25°C
.
The second column...
asked 24 minutes ago -
A horizontal wire is at y = 0. Current travels in the +x
direction. The magnetic...
asked 25 minutes ago -
Let X be a continuous random variable whose PDF is Let X be a
continuous random...
asked 46 minutes ago -
Martinez Company’s relevant range of production is 7,500 units
to 12,500 units. When it produces and...
asked 44 minutes ago -
A football with a mass of 1.2 kg is kicked from ground level to
a height...
asked 49 minutes ago -
Remember: Changes in supply determinants shift supply, and
changes in demand determinants shift demand. We say...
asked 48 minutes ago -
Why is the answer b), for this question? I came up with C) for
my incorrect...
asked 54 minutes ago