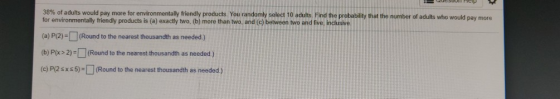
38% of adults would pay more for environmentally friendly products. You randomly select 10 adults Find the probability that the number of adults who would pay more for environmentally friendly products is (a) exactly two. (b) more than two, and (c) between two and five, inclusive (a) P(2)-(Round to the nearest thousandth as needed) (b) Px2)-(Round to the nearest thousandth as needed) (c) P(2 sxs5)-(Round to the nearest thousandth as needed)
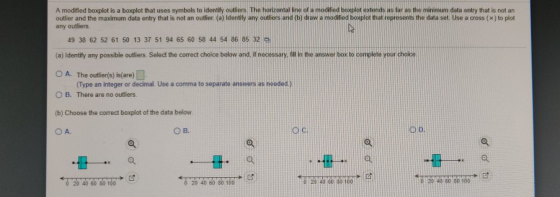
A modified boxplot is a boxplot that uses symbols to identily outiers. The horizontal ine of a modified boxplot extends as tar as the minimum data entry that is not an outlier and the maximum data entry that is not an outlier a dentify any outliers and b) draw a modified box lot that fepresents the data set. Use a cross ( × to plot any outliers 49 38 62 52 61 50 13 37 51 94 65 60 58 44 54 86 85 32 (a) Identify any possible outliers. Select the correct choice below and, if necessary, ill in the answer box to complete your choice O A. The outlierfs) is(are) 0 B. There are no outliers. (b) Choose the correct boxplot of the data below O A. (Type an integer or decimal. Use a comma to separate answers as needed) ов. a, 2040 60 80 100 0 20 40 60 80 100 0 20 40 30 30 100 0 20 40 60 80 100
Homework Answers
As per HomeworkLib policy i answered the first two parts


Add Answer to:
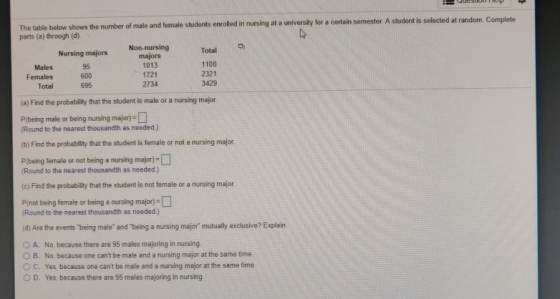
The table below shows the number of male and female students enrolled in nursing at a university for a certain semester A student is parts (a) through (d) selected at random. Complete Tota...
The table below shows the number of male and female students enrolled in nursing at a...
 The table below shows the number of male and female students enrolled in nursing at a universit Nursing majors Non-nursing majors Total Males Females Total 98 600 698 1019 1722 2741 2322 3439 (a) Find the probability that the student is male or a nursing major P(being male or being nursing major) (Round to the nearest thousandth as needed.) (b) Find the probability that the student is female or not a nursing major P(being female or not being a nursing...
The table below shows the number of male and femake students enrolled in nursing at a...
 The table below shows the number of male and femake students enrolled in nursing at a university for a certain semester. A student is selected at random. Complete parts (a) through (d) Nursing majors Non-nursing Total majors 1018 Males Females Total 97 600 697 1721 2739 1115 2321 3436 (a) Find the probability that the student is male or a nursing major P(being male or being nursing major)- (Round to the nearest thousandth as needed) (b) Find the probability that...
The table below shows the number of male and female students enrolled in nursing at a...
 The table below shows the number of male and female students enrolled in nursing at a particular university for a recent semester. (a) Find the probability that a randomly selected student is male, given that the student is a nursing major (b) Find the probability that a randomly selected student is a nursing major, given that the student is male. Males Females Total Nursing Majors Non-nursing majors Total 1154 2396 3550 91 733 824 1063 663 2726 (a) Find the...
The table below shows the results of a survey that asked 1060 adults from a certain country if they would support a change in their country's flag.
 The
table below shows the results of a survey that asked 1060 adults
from a certain country if they would support a change in their country's flag. A person is selected at random. Complete parts (a)
through (d). (a) Find the probability that the person opposed the change or is female.P(opposed the change or female) =(Round to the nearest thousandth as needed.)(b) Find the probability that the person supports the change or is male.P( supports the change or male) =(Round to...
The
table below shows the results of a survey that asked 1060 adults
from a certain country if they would support a change in their country's flag. A person is selected at random. Complete parts (a)
through (d). (a) Find the probability that the person opposed the change or is female.P(opposed the change or female) =(Round to the nearest thousandth as needed.)(b) Find the probability that the person supports the change or is male.P( supports the change or male) =(Round to...
The table below shows the results of a survey that asked 2864 people whether they are...
 The table below shows the results of a survey that asked 2864 people whether they are involved in any type of charity work. A person is selected at random from the sample. Complete parts (a) through (e). 9. Total 1472 1392 2864 Frequently Occasionally Not at all Male 224 Female 205 Total 429 456 440 896 792 747 1539 (a) Find the probability that the person is frequently or occasionally involved in charity work. P(being frequently involved or being occasionally...
The table below shows the results of a survey that asked 2860 people whether they are...
 The table below shows the results of a survey that asked 2860 people whether they are involved in any type of charity work. A person is selected at random from the sample. Complete parts (a) through (e) Occasionally 459 430 889 Not at all 797 744 1541 Total 1478 1382 2860 Frequently Male Female Total 208 430 (a) Find the probability that the person is frequently or occasionally involved in charity work. P(being frequently involved or being occasionally involved) (Round...
Psychologists at an university compared the levels of alcohol consumption of male and female freshman students....
 Psychologists at an university compared the levels of alcohol consumption of male and female freshman students. Each student was asked to estimate the amount of alcohol (beer, wine, or liquor) they consume in a typical week. Summary statistics for 128 males and 184 females are provided in the accompanying table 囲Click here to view the table a. For each gender, find a 95% confidence interval for mean weekly alcohol consumption For males, the 95% confidence interval is (DD, (Round to...
Psychologists at an university compared the levels of alcohol consumption of male and female freshman students....
 Psychologists at an university compared the levels of alcohol consumption of male and female freshman students. Each student was asked to estimate the amount of alcohol (beer, wine, or liquor) they consume in a typical week. Summary statistics for 126 males and 184 females are provided in the accompanying table Click here to view the table a. For each gender, find a 95% confidence interval for mean weekly alcohol consumption For males, the 95% confidence interval is ( (Round to...
This Test: 45 pts pos Find the indicated z-scores shown in the graph Click to view.page...
 This Test: 45 pts pos Find the indicated z-scores shown in the graph Click to view.page 1 of the Standard Normal Table The z-scores are Use a comma to separate answers as needed Round to two decimal places as needed ) Find the indicated probability using the standard normal distribution. P(z > 2.02) Click here to view page 1 of the standard normal table, Click here to view page 2 of the standard normal table P(Z> 2.02)(Round to four decimal...
1.2. Assume that the differences are normally distributed. Complete parts (a) through (d) below. 1 3...
 1.2.
Assume that the differences are normally distributed. Complete parts (a) through (d) below. 1 3 4 6 8 Observation X 2 53.4 5 49.0 7 46.1 43.3 46.2 42.4 51.4 51.7 46.9 52.9 48.8 47.3 51.9 54.8 46.7 52.6 - 2.6 - 4.9 - 2.9 -3.4 -0.6 -.9 d; -3.6 .5 (Type integers or decimals.) (b) Computed and sd d = -2.300 (Round to three decimal places as needed.) Sa = 1.805 (Round to three decimal places as needed.)...
1.2.
Assume that the differences are normally distributed. Complete parts (a) through (d) below. 1 3 4 6 8 Observation X 2 53.4 5 49.0 7 46.1 43.3 46.2 42.4 51.4 51.7 46.9 52.9 48.8 47.3 51.9 54.8 46.7 52.6 - 2.6 - 4.9 - 2.9 -3.4 -0.6 -.9 d; -3.6 .5 (Type integers or decimals.) (b) Computed and sd d = -2.300 (Round to three decimal places as needed.) Sa = 1.805 (Round to three decimal places as needed.)...
 The table below shows the number of male and female students enrolled in nursing at a universit Nursing majors Non-nursing majors Total Males Females Total 98 600 698 1019 1722 2741 2322 3439 (a) Find the probability that the student is male or a nursing major P(being male or being nursing major) (Round to the nearest thousandth as needed.) (b) Find the probability that the student is female or not a nursing major P(being female or not being a nursing...
 The table below shows the number of male and femake students enrolled in nursing at a university for a certain semester. A student is selected at random. Complete parts (a) through (d) Nursing majors Non-nursing Total majors 1018 Males Females Total 97 600 697 1721 2739 1115 2321 3436 (a) Find the probability that the student is male or a nursing major P(being male or being nursing major)- (Round to the nearest thousandth as needed) (b) Find the probability that...
 The table below shows the number of male and female students enrolled in nursing at a particular university for a recent semester. (a) Find the probability that a randomly selected student is male, given that the student is a nursing major (b) Find the probability that a randomly selected student is a nursing major, given that the student is male. Males Females Total Nursing Majors Non-nursing majors Total 1154 2396 3550 91 733 824 1063 663 2726 (a) Find the...
 The table below shows the results of a survey that asked 2864 people whether they are involved in any type of charity work. A person is selected at random from the sample. Complete parts (a) through (e). 9. Total 1472 1392 2864 Frequently Occasionally Not at all Male 224 Female 205 Total 429 456 440 896 792 747 1539 (a) Find the probability that the person is frequently or occasionally involved in charity work. P(being frequently involved or being occasionally...
 The table below shows the results of a survey that asked 2860 people whether they are involved in any type of charity work. A person is selected at random from the sample. Complete parts (a) through (e) Occasionally 459 430 889 Not at all 797 744 1541 Total 1478 1382 2860 Frequently Male Female Total 208 430 (a) Find the probability that the person is frequently or occasionally involved in charity work. P(being frequently involved or being occasionally involved) (Round...
 Psychologists at an university compared the levels of alcohol consumption of male and female freshman students. Each student was asked to estimate the amount of alcohol (beer, wine, or liquor) they consume in a typical week. Summary statistics for 128 males and 184 females are provided in the accompanying table 囲Click here to view the table a. For each gender, find a 95% confidence interval for mean weekly alcohol consumption For males, the 95% confidence interval is (DD, (Round to...
 Psychologists at an university compared the levels of alcohol consumption of male and female freshman students. Each student was asked to estimate the amount of alcohol (beer, wine, or liquor) they consume in a typical week. Summary statistics for 126 males and 184 females are provided in the accompanying table Click here to view the table a. For each gender, find a 95% confidence interval for mean weekly alcohol consumption For males, the 95% confidence interval is ( (Round to...
 This Test: 45 pts pos Find the indicated z-scores shown in the graph Click to view.page 1 of the Standard Normal Table The z-scores are Use a comma to separate answers as needed Round to two decimal places as needed ) Find the indicated probability using the standard normal distribution. P(z > 2.02) Click here to view page 1 of the standard normal table, Click here to view page 2 of the standard normal table P(Z> 2.02)(Round to four decimal...
 1.2.
Assume that the differences are normally distributed. Complete parts (a) through (d) below. 1 3 4 6 8 Observation X 2 53.4 5 49.0 7 46.1 43.3 46.2 42.4 51.4 51.7 46.9 52.9 48.8 47.3 51.9 54.8 46.7 52.6 - 2.6 - 4.9 - 2.9 -3.4 -0.6 -.9 d; -3.6 .5 (Type integers or decimals.) (b) Computed and sd d = -2.300 (Round to three decimal places as needed.) Sa = 1.805 (Round to three decimal places as needed.)...
1.2.
Assume that the differences are normally distributed. Complete parts (a) through (d) below. 1 3 4 6 8 Observation X 2 53.4 5 49.0 7 46.1 43.3 46.2 42.4 51.4 51.7 46.9 52.9 48.8 47.3 51.9 54.8 46.7 52.6 - 2.6 - 4.9 - 2.9 -3.4 -0.6 -.9 d; -3.6 .5 (Type integers or decimals.) (b) Computed and sd d = -2.300 (Round to three decimal places as needed.) Sa = 1.805 (Round to three decimal places as needed.)...
Most questions answered within 3 hours.
-
What is the hydroxide ion concentration, [OH-], in a solution
with a hydronium ion concentration, [H3O+]...
asked 9 minutes ago -
For Bergson the concept of Being contains less reality than does
the concept of Becoming. True...
asked 23 minutes ago -
What species is the reducing agent in the following
equation?
Mg(s) + 2HCl (aq) --> MgCl2(aq)...
asked 25 minutes ago -
A 50g ice cube is taken out of a freezer at 0 degrees Celsius
and put...
asked 2 hours ago -
How do ratios help you determine trends? What specific
information do managers look at? Is there...
asked 2 hours ago -
A wavelength of 514 nm is used to find an unknown diffraction
grating. If the separation...
asked 2 hours ago -
Use the central limit theorem to find the mean and standard
error of the mean of...
asked 2 hours ago -
You will be given a file that will contain averages for classes
which are divided into...
asked 2 hours ago -
A Pew Research Center poll surveyed a random sample 850 voters
and asked them if they...
asked 2 hours ago -
Design a class named
NumDays, to
store a value that represents a number of hours and...
asked 2 hours ago -
(R)-2-chloro-(S)-3-bromobutane and
(S)-2-chloro-(S)-3-bromobutane are: A. enantiomers. B.
diastereomers. C. meso compounds. D. the same molecule.
asked 2 hours ago -
1_ What is the Frank-Starling law of the heart? And why the
heart cannot function on...
asked 2 hours ago