![Davis AA #3a [Compatibility Mode]. Excel (Product Activation Failed) me Insert Page Layout Formulas Review View Show Queries](http://img.homeworklib.com/images/0e756739-1dfa-4ad5-aca3-86121e27c5e8.png?x-oss-process=image/resize,w_560)
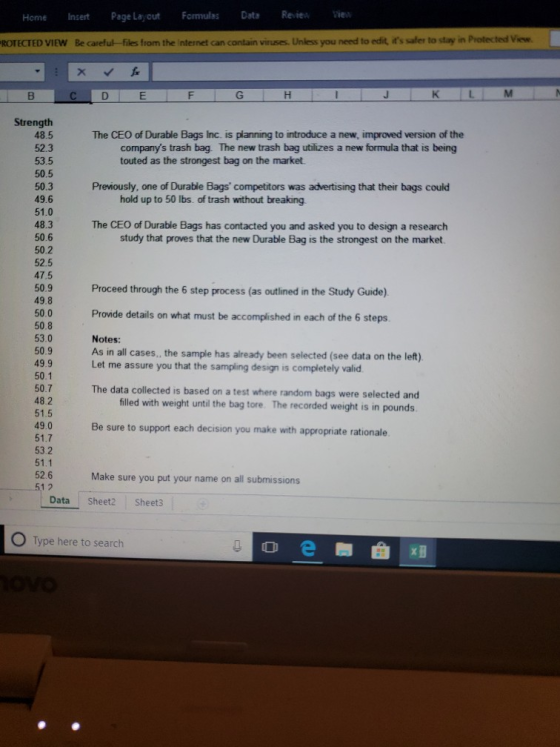
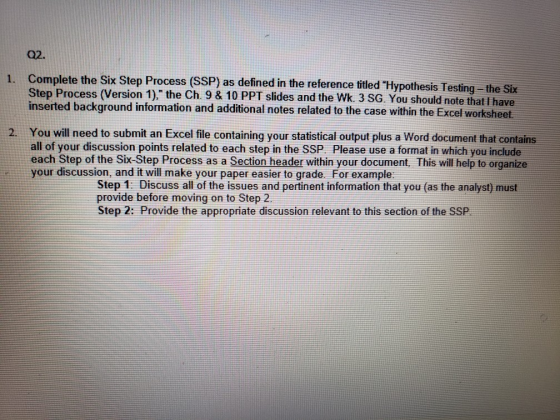
02. 1. Complete the Six Step Process (SSP) as defined Step Process (Version 1)," the Ch. 9 & 10 PPT slides and the Wk. 3 SG. You should note that I ha inseited background information and additional notes related to the case within the Excel worksheet in the reference titled"Hypothesis Testing the Six You will need to submit an Excel file containing your statistical output plus a Word document that contains all of your discussion points related to each step in the SSP Please use a format in which you include each Step of the Six-Step Process as a Section header within your document, This will help to organize your discussion, and it will make your paper easier to grade For example: 2. Step 1 Discuss all of the issues and pertinent information that you (as the analyst) must provide before moving on to Step 2 Step 2: Provide the appropriate discussion relevant to this section of the SSP
Davis AA #3a [Compatibility Mode]. Excel (Product Activation Failed) me Insert Page Layout Formulas Review View Show Queries EE From Tablke Ll Connections Flash Fill Ba Consolidate Properties B- Remove Duplicates Relationships Sort Filter Advanced Columns Data Validation. Manage Data Model Ann ssrroheet Subi . Lo Recent Sources A Text to Edit Links : what-if Forecast 2§Ung Advanced Columns Eo Data ValidationManage Data Model Analysis Sheet All- Get & Transform Connections Sort & Filter Data Tools Forecast Column1 Column 1 Column1 50.575 0.259900129 50.65 50.9 1.643752742 2.701923077 -0.215103263 0.0549271 50.575 0.259900129 50.65 50.9 Mean 50.575 0.259900129 Mean Standard Error Standard Error Standard Error Median Median Median 50.65 50.9 1.643752742 Mode Standard Deviation Mode Mode Standard Deviation Standard Deviation Sample Variance Kurtosis 1.643752742 Sample Variance Kurtosis 2.701923077 0.215103263 0.0549271 Sample Variance Kurtosis 2.701923077 0.215103263 0.0549271 7.2 46.8 54 Skewness Skewness Skewness Range Minimum Range Range 46.8 54 Minimum 46.8 Minimum Maximum Maximum Maximum 2023 2023 2023 Sum Count Count 0703786985 Confidence Level(95.0%) 0.525697631 Confidence Level(99.0%) Confidence Level(90.0%) 0.437899261 Var List Data Q1 Output Q2 Outout
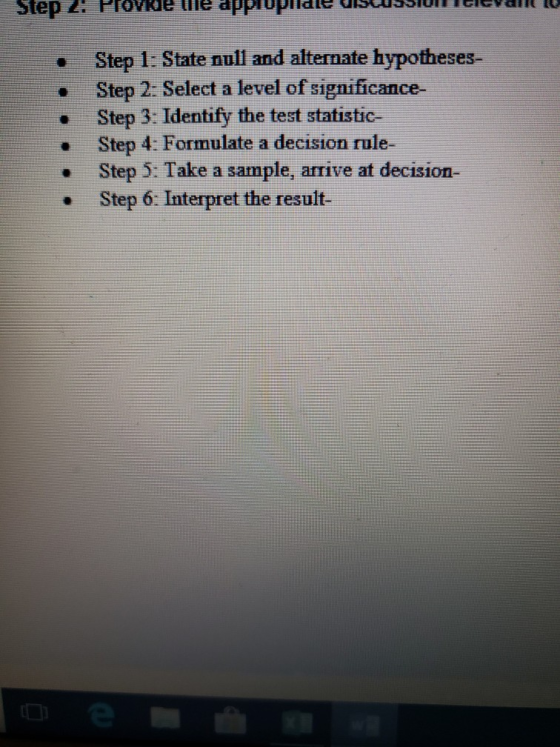
Step 1 State null and alternate hypotheses- Step 2: Select a level of significance- Step 3: Identify the test statistic- . Step 4: Formulate a decision rule- Step 5: Take a sample, arrive at decision- Step 6: Interpret the result-
Homework Answers
Answer:
Add Answer to:
Home Insert Page Layout Formulas Dats Reve ROTECTED VIEW Be careful fFiles from the Internet can contain vinuses. Unless you need to edit, it's saler to stay in Protected View C D...
02. 1. Complete the Six Step Process (SSP) as defined Step Process (Version 1)," the Ch....
 02. 1. Complete the Six Step Process (SSP) as defined Step Process (Version 1)," the Ch. 9 & 10 PPT slides and the Wk. 3 SG. You should note that I ha inseited background information and additional notes related to the case within the Excel worksheet in the reference titled"Hypothesis Testing the Six You will need to submit an Excel file containing your statistical output plus a Word document that contains all of your discussion points related to each step...
Internet can contain viruses. Unless you need to edit, it's safer to stay in Protected View...
 Internet can contain viruses. Unless you need to edit, it's safer to stay in Protected View -ut interruption, please reactivate now. Reactivate Enable Editing MERIWELL COMPANY I Finished goods inventory, beginning Finished goods inventory, ending Depreciation, factory Administrative expenses Utilities, factory Maintenance, factory Supplies, factory Insurance, factory Purchases of raw materials Raw materials inventory, beginning Raw materials inventory, ending Direct labour Indirect labour Work in process inventory, beginning Work in process inventory, ending Sales Selling expenses $20,000 40,000 27,000 110,000...
 02. 1. Complete the Six Step Process (SSP) as defined Step Process (Version 1)," the Ch. 9 & 10 PPT slides and the Wk. 3 SG. You should note that I ha inseited background information and additional notes related to the case within the Excel worksheet in the reference titled"Hypothesis Testing the Six You will need to submit an Excel file containing your statistical output plus a Word document that contains all of your discussion points related to each step...
 Internet can contain viruses. Unless you need to edit, it's safer to stay in Protected View -ut interruption, please reactivate now. Reactivate Enable Editing MERIWELL COMPANY I Finished goods inventory, beginning Finished goods inventory, ending Depreciation, factory Administrative expenses Utilities, factory Maintenance, factory Supplies, factory Insurance, factory Purchases of raw materials Raw materials inventory, beginning Raw materials inventory, ending Direct labour Indirect labour Work in process inventory, beginning Work in process inventory, ending Sales Selling expenses $20,000 40,000 27,000 110,000...
Most questions answered within 3 hours.
-
Suppose that A and B are mutually exclusive and complementary
events, such that P(A)=0.7 and P(B)=0.3....
asked 16 minutes ago -
What parallels can you draw from the African-American performers
Bill" Bojangles" Robinson, James Brown and Michael...
asked 4 minutes ago -
What cognitive disorder does the individual in Oliver
Sacks' book 'The Man Who Mistook His Wife...
asked 10 minutes ago -
how
are genetically identical populations regulated
asked 7 minutes ago -
1. A smaller animal is more likely to be a(n)
insectivore than a frugivore, because it...
asked 16 minutes ago -
While shopping for a car loan, you get the following offers:
Solid Savings & Loan is...
asked 17 minutes ago -
True or False
CSST is 1% of the Quebec payroll remitted to RQ.
asked 13 minutes ago -
The deduction for mortgage interest on your personal residence
(s) is limited to how many homes?...
asked 14 minutes ago -
Please use the python to write
Assume that a system has a 32-bit virtual address with...
asked 20 minutes ago -
Fisk Corporation is trying to improve its inventory control
system and has installed an online system...
asked 32 minutes ago -
1. What does the acronym CERO stand for? How are the eliminating
entries E and R...
asked 39 minutes ago -
Using data from Appendix C in the textbook, write the
equilibrium-constant expression and calculate the value...
asked 39 minutes ago