My project has to do with the average tuition for in-state students per semester and the proportion of western states that pay less than $5000 for tuition. Western states include Alaska, Arizona, California, Colorado, Hawaii, Idaho, Montana, Nevada, New Mexico, Oregon, Utah, Washington and Wyoming. I need help with the best method of graphing this and how to create the confidence intervals for 95% for BOTH the average tuition for in state students AND the proportion of western states that pay less than $5000. What test would I use for the confidence intervals and what distribution do I use? (T-test, Z-test, etc)
Here is the data: 
Homework Answers
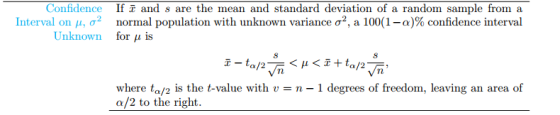
for first question
that is to find the confidence interval of mean
use t-test as population standard deviation is not known
following is formula for confidence interval
For 2nd question
use z-test for one proportion
p^ =X/n
n is sample size
X is number of states where tuition fee is less than $5000
formula for confidence interval

Add Answer to:
My project has to do with the average tuition for in-state students per semester and the proportion of western states th...
Rate 3% 12% 14% 8% 9% 596 State Rate State 1090 | Kansas 11% Kentucky 13%...
 Rate 3% 12% 14% 8% 9% 596 State Rate State 1090 | Kansas 11% Kentucky 13% Louisiana 1296 | Maine 8% Maryland 690 590 | Michigan 890 | Minnesota 996 | Mississippi 1196 | Missouri 1390 | Montana 1090 | Nebraska 996 | Nevada 996| New Hampshire 590 796 | New Jersey 1290 | South Dakota 996 | Tennessee Alabama Alaska Arizona Arkansas California Colorado Connecticut Delaware Florida Georgia Hawaii Idaho Illinois Indiana Iowa New Mexico New York North Carolina...
C++ how can I input this data correctly? State, Coal, Natural Gas, Fuel Oil, Jet Fuel,HGL...
C++ how can I input this data correctly? State, Coal, Natural Gas, Fuel Oil, Jet Fuel,HGL Other, Motor Gasoline, Residual Fuel Oil, Nuclear Electric Power, Hydroelectric Power, Wood and Waste, Fuel Ethanol, Geothermal, Solar, Wind Alabama,410.20,715.70,169.40,18.00,44.90,309.10,11.90,417.30,64.50,167.40,23.70,0.10,0.40,0.00 Alaska,16.60,330.90,64.40,104.80,28.60,35.20,0.00,0.00,15.30,2.30,0.00,0.20,0.05,1.60 Arizona,323.90,371.50,149.10,24.90,33.90,324.30,0.00,338.60,66.20,6.60,24.70,0.30,52.80,5.00 Arkansas,246.40,315.70,113.60,8.50,36.40,170.10,0.05,140.40,33.00,77.90,13.00,0.80,0.40,0.00 California,32.10,2248.40,560.40,672.60,383.00,1714.40,145.80,197.80,267.20,137.00,131.30,107.90,267.10,124.70 Colorado,321.50,501.10,103.90,52.50,50.20,263.80,0.00,0.00,17.60,10.60,20.20,0.80,9.50,87.00 Connecticut,2.30,254.70,94.90,9.50,25.10,168.30,0.80,173.40,2.10,25.20,12.90,0.05,4.10,0.10 Delaware,8.20,113.60,14.30,0.70,32.80,54.30,1.10,0.00,0.00,1.80,4.20,0.40,1.10,0.05 DC,0.05,30.10,2.80,0.00,3.45,13.30,0.00,0.00,0.00,0.80,1.00,0.05,0.30,0.00 Florida,426.20,1414.10,312.10,155.40,86.30,1008.80,59.10,306.70,1.60,182.50,69.80,10.10,30.20,0.00 Georgia,399.30,728.00,226.50,29.30,58.40,540.30,8.50,360.60,31.10,214.20,37.40,0.30,10.20,0.00 Hawaii,16.40,0.20,26.20,74.30,20.90,52.80,60.90,0.00,0.80,8.50,4.00,2.40,9.80,5.90 Idaho,2.40,110.30,70.90,5.50,13.20,88.20,0.05,0.00,83.40,22.70,6.70,2.20,0.40,23.80 Illinois,702.50,1045.20,297.30,161.00,241.50,544.70,0.60,1031.30,1.20,24.30,40.30,2.00,2.00,98.40 Indiana,948.40,780.10,235.00,50.20,121.10,357.50,1.70,0.00,3.90,30.40,25.20,4.60,2.40,45.20 Iowa,298.00,317.20,150.10,5.50,84.90,192.10,0.05,49.20,8.50,20.10,16.30,1.30,0.60,185.30 Kansas,253.10,278.10,119.50,8.70,59.80,154.20,3.60,86.20,0.30,6.30,10.70,1.00,0.10,130.30 Kentucky,736.60,284.10,156.20,68.00,123.70,250.80,0.05,0.00,32.10,35.20,17.80,2.70,0.40,0.00 Louisiana,140.50,1697.40,192.20,166.10,1253.90,254.50,37.70,179.40,10.20,136.30,19.50,1.80,1.80,0.00 Maine,2.20,54.50,70.70,6.50,20.30,89.60,3.80,0.00,27.70,90.60,6.60,0.10,0.40,15.40 Maryland,162.90,229.60,98.50,8.80,33.70,306.50,0.70,154.40,12.90,26.00,23.20,0.60,6.80,4.90 Massachusetts,20.10,442.70,144.60,60.90,33.90,315.10,4.70,56.60,6.60,37.40,24.10,0.90,17.50,2.00 Michigan,471.20,927.50,171.70,22.80,119.00,536.90,3.20,330.00,14.40,92.90,37.30,5.20,1.10,43.40 Minnesota,261.20,466.50,160.30,27.30,113.60,296.10,0.80,145.00,11.20,72.50,27.60,1.10,0.60,91.70 Mississippi,61.20,563.40,122.00,97.20,63.00,196.10,3.60,61.70,0.00,56.30,15.00,1.00,0.10,0.00 Missouri,639.90,273.60,188.10,16.60,57.00,362.70,0.10,98.60,11.70,26.40,26.10,0.40,1.90,10.40 Montana,161.90,77.60,50.20,5.40,50.80,61.00,0.00,0.00,93.10,4.40,4.70,0.30,0.10,19.80 Nebraska,240.50,172.90,111.40,7.50,17.70,102.20,0.00,97.80,7.90,4.10,7.10,1.20,0.10,35.10 Nevada,30.80,316.00,64.30,35.00,14.10,131.80,0.00,0.00,16.50,2.50,10.00,32.50,33.30,3.20 New Hampshire,5.30,59.50,40.30,2.50,21.60,80.20,1.50,112.60,10.60,35.80,6.00,0.05,0.50,4.00 New Jersey,17.50,795.10,176.30,187.20,109.40,469.70,25.00,312.60,0.10,28.40,35.90,0.50,22.20,0.20 New Mexico,197.10,259.60,92.30,7.20,30.80,107.80,0.00,0.00,1.40,6.30,8.30,0.50,8.60,33.30 New York,29.70,1335.10,330.10,201.20,98.70,635.30,40.00,434.80,248.20,76.50,46.60,1.20,10.60,36.40 North Carolina,381.80,540.20,190.90,14.90,81.50,531.00,0.50,447.50,40.80,110.20,36.70,1.00,33.40,0.10 North Dakota,394.60,105.80,84.80,5.60,27.40,49.60,0.00,0.00,17.70,2.60,3.80,1.00,0.05,75.40 Ohio,825.30,996.90,290.50,67.40,180.50,576.80,3.90,175.90,4.60,52.70,40.10,3.40,1.90,11.50 Oklahoma,221.80,738.40,175.00,52.60,83.30,222.40,2.60,0.00,23.80,31.00,15.50,0.05,0.10,185.30 Oregon,19.40,249.80,100.20,28.60,24.60,178.50,0.80,0.00,319.00,59.40,13.50,2.90,3.10,66.10 Pennsylvania,734.80,1363.80,327.30,69.20,188.70,556.60,3.50,867.30,21.90,104.70,39.80,2.20,4.10,32.10...
Listed below is the median household income for the 50 states and the District of Columbia....
Listed below is the median household income for the 50 states and the District of Columbia. State, Amount Alabama 42278 Alaska 67629 Arizona 49254 Arkansas 44922 California 60487 Colorado 60940 Connecticut 70161 Delaware 57522 DC 68277 Florida 46140 Georgia 49555 Hawaii 71223 Idaho 53438 Illinois 54916 Indiana 48060 Iowa 57810 Kansas 53444 Kentucky 42786 Louisiana 42406 Maine 51710 Maryland 76165 Massachusetts 63151 Michigan 52005 Minnesota 67244 Mississippi 35521 Missouri 56630 Montana 51102 Nebraska 56870 Nevada 49875 New Hampshire 73397 New...
The accompanying table shows the average price for a gallon of gas for the 50 states...
The accompanying table shows the average price for a gallon of gas for the 50 states during April 2012. State Price per Gallon Alaska 4.36 Alabama 3.79 Arkansas 3.76 Arizona 3.87 California 4.22 Colorado 3.89 Connecticut 4.17 Delaware 3.89 Florida 3.94 Georgia 3.83 Hawaii 4.61 Iowa 3.75 Idaho 3.77 Illinois 4.06 Indiana 3.95 Kansas 3.71 Kentucky 3.92 Louisiana 3.80 Massachusetts 3.91 Maryland 3.96 Maine 4.00 Michigan 3.93 Minnesota 3.72 Missouri 3.67 Mississippi 3.78 Montana 3.77 North Carolina 3.89 North Dakota...
JAVA: File USCapitals.txt is here: Alabama, Montgomery Alaska, Juneau Arizona, Phoenix Arkansas, Little Rock California, Sacramento...
JAVA: File USCapitals.txt is here: Alabama, Montgomery Alaska, Juneau Arizona, Phoenix Arkansas, Little Rock California, Sacramento Colorado, Denver Connecticut, Hartford Delaware, Dover Florida, Tallahassee Georgia, Atlanta Hawaii, Honolulu Idaho, Boise Illinois, Springfield Indiana, Indianapolis Iowa, Des Moines Kansas, Topeka Kentucky, Frankfort Louisiana, Baton Rouge Maine, Augusta Maryland, Annapolis Massachusettes, Boston Michigan, Lansing Minnesota, Saint Paul Mississippi, Jackson Missouri, Jefferson City Montana, Helena Nebraska, Lincoln Nevada, Carson City New Hampshire, Concord New Jersey, Trenton New York, Albany New Mexico, Santa Fe...
Write a C# windows forms program to create a States and Capitals guessing game. A method...
Write a C# windows forms program to create a States and Capitals guessing game. A method in your program should generate a random number between 1 and 50. Your program should use this number to represent one of the 50 U.S states and then display the name of that state. The user will guess the capital of that state. Another method in your program should get the users answer and check to see whether it is correct. Yet another method...
Math 146 Boxplot Quiz The following data, from the BLS (Bureau of Labor Statistics) gives the...
 Math 146 Boxplot Quiz The following data, from the BLS (Bureau of Labor Statistics) gives the unemployment rate, first for a sample of 10 Western US states, then for a sample of 10 Eastern US states. Florida New Hampshire 3.8 Maryland Michigan West Virginia 7.2 Mississippi Indiana Connecticut North Carolina 5.7 Maine West 5.7 Californmia Wyoming Alaska Montana Oklahoma Oregon Hawaii Utah Arizona South Dakota East 6.4 4.1 6.8 3.9 4.3 5.3 4.1 3.5 5.8 3.8 5.3 5.5 6.7 5.1...
Where are the nurses? Table 1.5 gives the number of ac- tive nurses per 100,000 people...
 Where are the nurses? Table 1.5 gives the number of ac- tive nurses per 100,000 people in each state.5 .35 URSES (a) Why is the number of nurses per 100,000 people a better measure of the availability of nurses than a simple count of the number of nurses in a state? (b) Make a histogram that displays the distribution of nurses per 100,000 people. Write a brief description of the distribution. Are there any outliers? If so, can you explain...
Eastern vs. Western States’ Spending on K-12 Education in 2014 Using the data below, compare how...
Eastern vs. Western States’ Spending on K-12 Education in 2014 Using the data below, compare how much the states East of the Mississippi spend on their K-12 students with how much states West of the Mississippi spend on their K-12 students. Make sure to create a numerical display (make a picture!), describe each distribution (in terms of shape, center and spread) and answer the question: who spends more? Data in Desmos (Links to an external site.). Eastern State $ per...
Determine the mean and standard deviation of your sample. Find the 80%, 95%, and 99% confidence...
Determine the mean and standard deviation of your sample. Find the 80%, 95%, and 99% confidence intervals. Make sure to list the margin of error for the 80%, 95%, and 99% confidence interval. Create your own confidence interval (you cannot use 80%, 95%, and 99%) and make sure to show your work. Make sure to list the margin of error. Problem Analysis—Write a half-page reflection. What trend do you see takes place to the confidence interval as the confidence level...
 Rate 3% 12% 14% 8% 9% 596 State Rate State 1090 | Kansas 11% Kentucky 13% Louisiana 1296 | Maine 8% Maryland 690 590 | Michigan 890 | Minnesota 996 | Mississippi 1196 | Missouri 1390 | Montana 1090 | Nebraska 996 | Nevada 996| New Hampshire 590 796 | New Jersey 1290 | South Dakota 996 | Tennessee Alabama Alaska Arizona Arkansas California Colorado Connecticut Delaware Florida Georgia Hawaii Idaho Illinois Indiana Iowa New Mexico New York North Carolina...
 Math 146 Boxplot Quiz The following data, from the BLS (Bureau of Labor Statistics) gives the unemployment rate, first for a sample of 10 Western US states, then for a sample of 10 Eastern US states. Florida New Hampshire 3.8 Maryland Michigan West Virginia 7.2 Mississippi Indiana Connecticut North Carolina 5.7 Maine West 5.7 Californmia Wyoming Alaska Montana Oklahoma Oregon Hawaii Utah Arizona South Dakota East 6.4 4.1 6.8 3.9 4.3 5.3 4.1 3.5 5.8 3.8 5.3 5.5 6.7 5.1...
 Where are the nurses? Table 1.5 gives the number of ac- tive nurses per 100,000 people in each state.5 .35 URSES (a) Why is the number of nurses per 100,000 people a better measure of the availability of nurses than a simple count of the number of nurses in a state? (b) Make a histogram that displays the distribution of nurses per 100,000 people. Write a brief description of the distribution. Are there any outliers? If so, can you explain...
Most questions answered within 3 hours.
-
What do you think every computer science department must teach,
concerning the fact that technology rapidly...
asked 7 minutes ago -
home / study / science / physics / physics questions and answers
/ 2. an object...
asked 9 minutes ago -
An open cart is travelling at constant speed on a level surface.
A load of coal...
asked 13 minutes ago -
A ski-jumper leaves the ski track moving in the horizontal
direction with a speed of 25.0...
asked 22 minutes ago -
A commercial lubricant, Dubdeefordy, has K = SN/SM = 13.1 for
immiscible solvent M and N....
asked 45 minutes ago -
Are there any potential drawback to the job-crafting approach?
If so, how can they be minimized?
asked 22 minutes ago -
12. To accommodate growth until a new version of IP could be
standardized and adopted, a...
asked 27 minutes ago -
Create a separation scheme flow chart/diagram to isolate methyl
salicylate from a product mixture containing the...
asked 27 minutes ago -
5. The animals of which phylum use a water vascular system in
locomotion, feeding and gas...
asked 52 minutes ago -
*HOW DO I CHANGE THIS FROM A VOID FUNCTION TO A NON-VOID
WITH PARAMETERS?*
#include<iostream>
#include<fstream>...
asked 40 minutes ago -
I have a matrix, A= rand(2,3,2) ans(:,:,1) = 0.8116 0.3507
0.8759 0.5328 0.9390 0.5502 ans(:,:,2) =...
asked 44 minutes ago -
Examine several recent mergers and suggest the principal motives
for merging in each case. Discuss three...
asked 47 minutes ago