Also:
Based on the regression results, solve for the predicted MPGavg for 8 cylinder cars.
and
Based on the regression results, what is the best answer concerning average MPG for 4 cylinder SUVs.
a. 4 cylinder SUVs have statistically higher average MPG when compared to 8 cylinder SUVs.
b. The number of cylinders does not help explain average MPG.
c. 6 cylinder SUVs do not have statistically higher average MPG when compared to 8 cylinder SUVs.
d. 4 cylinder SUVs have statistically higher average MPG when compared to 6 cylinder SUVs.
Homework Answers
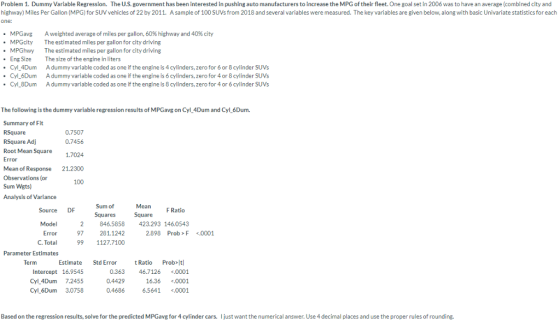
y^ = 16.9545 + 7.2455 Cyl_4Dum + 3.0758 Cyl_6Dum
For 8Ccyliner cars
y^ = 16.9545
for 4 cylinder
y^ = 16.9545 + 7.2455
= 24.2
option A) is correct
a. 4 cylinder SUVs have statistically higher average MPG when compared to 8 cylinder SUVs.
Add Answer to:
Also: Based on the regression results, solve for the predicted MPGavg for 8 cylinder cars. and Based on the regression...
Based on the information above, what proportion of the SUVs are 8 cylinder vehicles (I want...
 Based on the information above, what
proportion of the SUVs are 8 cylinder vehicles (I want the
proportion and not the percentage)? I just want the
numerical answer. Use 4 decimal places and use the proper rules of
rounding. PLEASE SHOW WORK
Problem 1. Correlation. The U.S. government has been interested in pushing auto manufacturers to increase the MPG of their fleet. One goal set in 2006 was to have an average (combined city and highway) Miles Per Gallon (MPG)...
Based on the information above, what
proportion of the SUVs are 8 cylinder vehicles (I want the
proportion and not the percentage)? I just want the
numerical answer. Use 4 decimal places and use the proper rules of
rounding. PLEASE SHOW WORK
Problem 1. Correlation. The U.S. government has been interested in pushing auto manufacturers to increase the MPG of their fleet. One goal set in 2006 was to have an average (combined city and highway) Miles Per Gallon (MPG)...
Question 22 3 pts A regression analysis was done on 81 different SUV vehicles. The variables...
 Question 22 3 pts A regression analysis was done on 81 different SUV vehicles. The variables analyzed Included are the average gas mileage in miles per gallon (Average MPG) and the engine size in liters (Engine Size). The average miles per gallon is a weighted average of city and highway driving to reflect a 40/60 percent split. The estimated regression equation is: Average MPG = 27.654 - 2.114*Engine Size R-squared = .4615 Based on the regression model, the estimated value...
Please assist with the following: Consider the data in Table 1: What is the average miles...
Please assist with the following: Consider the data in Table 1: What is the average miles per gallon for city driving? On Average, how much higher is the miles per gallon for highway driving as compared to city driving? What percentage of the cars have four-cylinder engines? What percentage of the cars use Regular fuel? Table 1: ECONOMY INFORMATION FOR 10 AUTOMOBILES Car Size Cylinders City MPG Highway MPG Fuel Audi 8 Large 12 13 19 Premium BMW 328Xi Compact...
The Motor Trend Car Road Tests dataset mtcars, in faraway R package, was extracted from the...
The Motor Trend Car Road Tests dataset mtcars, in faraway R package, was extracted from the 1974 Motor Trend US magazine, and comprises fuel consumption and 10 aspects of automobile design and performance for 32 automobiles (1973–74 models). The data frame has 32 observation on 11 (numeric) variables: mpg: Miles/(US) gallon; cyl: Number of cylinders; disp: Displacement (cu.in.); hp: Gross horsepower; drat: Rear axle ratio; wt: Weight (1000 lbs); qsec: 1/4 mile time; vs: Engine (0 = V-shaped, 1 =...
Stan Moneymaker has been informed of a major automobile manufacturer?s plan to conserve on gasoline consumption...
 Stan Moneymaker has been informed of a major automobile manufacturer?s plan to conserve on gasoline consumption through improved engine design. The idea is called engine displacement, and it works by switching from 8-cylinder operation to 4-cylinder operation at approximately 40 miles per hour. Engine displacement allows enough power to accelerate from a standstill and to climb hills while also permitting the automobile to cruise at speeds over 40 miles per hour with little loss in driving performance. The trade literature...
1. Xis a normally distributed random variable with a mean of 12 and a standard deviation of 3. Calculate the probability that x equals 19.62. 2. A simple random sample of 8 employees of a corpora...
 1. Xis a normally distributed random variable with a mean of 12 and a standard deviation of 3. Calculate the probability that x equals 19.62. 2. A simple random sample of 8 employees of a corporation provided the following information 25 32 26 54 22 23 Determine the point estimate for the average age of all employees. What is the point estimate for the standard deviation of the population? Determine a point estimate for the proportion of all employees who...
The accompanying data represent the weights of various domestic cars and their gas mileages in the...
The accompanying data represent the weights of various domestic cars and their gas mileages in the city. The linear correlation coefficient between the weight of a car and its miles per gallon in the city is r = −0.978. The least-squares regression line treating weight as the explanatory variable and miles per gallon as the response variable is ŷ=−0.0067x+43.2680. Car Weight (pounds), x Miles per Gallon, y 1 3,765 18 2 3,984 17 3 3,530 21 4 3,175 23 5 ...
1. For each of the following regression models, write down the X matrix and 3 vector....
 1. For each of the following regression models, write down the X matrix and 3 vector. Assume in both cases that there are four observations (a) Y BoB1X1 + B2X1X2 (b) log Y Bo B1XiB2X2+ 2. For each of the following regression models, write down the X matrix and vector. Assume in both cases that there are five observations. (a) YB1XB2X2+BXE (b) VYBoB, X,a +2 log10 X2+E regression model never reduces R2, why 3. If adding predictor variables to a...
Objective: Find out the “true” MPG (Miles Per Gallon) of a vehicle, given a group of...
Objective: Find out the “true” MPG (Miles Per Gallon) of a vehicle, given a group of conditions which the user provides values for. 5 are given, 1 you create on your own. Requirements: Prompt the user for the car’s MPG first. i.e. Please Enter MPG: 26 Then prompt the user to enter a value for six factors which will affect the MPG of the vehicle, prompting for single value inputs after showing menus (i.e. a series of println() statements showing...
The accompanying data represent the weights of various domestic cars and their gas mileages in the...
 The accompanying data represent the weights of various domestic cars and their gas mileages in the city. The linear correlation coefficient between the weight of a car and its miles per gallon in the city is r= -0.974. The least-squares regression line treating weight as the explanatory variable and miles per gallon as the response variable is y = -0.0066x + 43.3298. Complete parts (a) through (c) below. E:: Click the icon to view the data table. (a) What proportion...
 Based on the information above, what
proportion of the SUVs are 8 cylinder vehicles (I want the
proportion and not the percentage)? I just want the
numerical answer. Use 4 decimal places and use the proper rules of
rounding. PLEASE SHOW WORK
Problem 1. Correlation. The U.S. government has been interested in pushing auto manufacturers to increase the MPG of their fleet. One goal set in 2006 was to have an average (combined city and highway) Miles Per Gallon (MPG)...
Based on the information above, what
proportion of the SUVs are 8 cylinder vehicles (I want the
proportion and not the percentage)? I just want the
numerical answer. Use 4 decimal places and use the proper rules of
rounding. PLEASE SHOW WORK
Problem 1. Correlation. The U.S. government has been interested in pushing auto manufacturers to increase the MPG of their fleet. One goal set in 2006 was to have an average (combined city and highway) Miles Per Gallon (MPG)...
 Question 22 3 pts A regression analysis was done on 81 different SUV vehicles. The variables analyzed Included are the average gas mileage in miles per gallon (Average MPG) and the engine size in liters (Engine Size). The average miles per gallon is a weighted average of city and highway driving to reflect a 40/60 percent split. The estimated regression equation is: Average MPG = 27.654 - 2.114*Engine Size R-squared = .4615 Based on the regression model, the estimated value...
 Stan Moneymaker has been informed of a major automobile manufacturer?s plan to conserve on gasoline consumption through improved engine design. The idea is called engine displacement, and it works by switching from 8-cylinder operation to 4-cylinder operation at approximately 40 miles per hour. Engine displacement allows enough power to accelerate from a standstill and to climb hills while also permitting the automobile to cruise at speeds over 40 miles per hour with little loss in driving performance. The trade literature...
 1. Xis a normally distributed random variable with a mean of 12 and a standard deviation of 3. Calculate the probability that x equals 19.62. 2. A simple random sample of 8 employees of a corporation provided the following information 25 32 26 54 22 23 Determine the point estimate for the average age of all employees. What is the point estimate for the standard deviation of the population? Determine a point estimate for the proportion of all employees who...
 1. For each of the following regression models, write down the X matrix and 3 vector. Assume in both cases that there are four observations (a) Y BoB1X1 + B2X1X2 (b) log Y Bo B1XiB2X2+ 2. For each of the following regression models, write down the X matrix and vector. Assume in both cases that there are five observations. (a) YB1XB2X2+BXE (b) VYBoB, X,a +2 log10 X2+E regression model never reduces R2, why 3. If adding predictor variables to a...
 The accompanying data represent the weights of various domestic cars and their gas mileages in the city. The linear correlation coefficient between the weight of a car and its miles per gallon in the city is r= -0.974. The least-squares regression line treating weight as the explanatory variable and miles per gallon as the response variable is y = -0.0066x + 43.3298. Complete parts (a) through (c) below. E:: Click the icon to view the data table. (a) What proportion...
Most questions answered within 3 hours.
-
1) Name the three holes located in the greater wing of the
sphenoid bone in order...
asked 38 seconds ago -
For the following reaction set-up, which type of hydrocarbon
product would form? 1,4-hexadiene + two Cl2...
asked 3 minutes ago -
Consider the following method that is intended to determine if
the double values d1 and d2...
asked 15 minutes ago -
could someone please post clear drawings of the three structures
in the equilibrium mixture of D-glucose...
asked 22 minutes ago -
Using the Properties of Order show that 5n5 +
4n4 + 6n3 + 2n2+ n +...
asked 25 minutes ago -
What is experiential learning and how is it helpful for teaching
leadership, and interpreting group dynamics?...
asked 25 minutes ago -
A security awareness policy defines the responsibilities of
managers and information owners.
True
False
asked 26 minutes ago -
which is the equilibrium expression for the reaction
3A(g)+4B(g)<---> 2C(g)+5D(g)
asked 27 minutes ago -
Create a balanced compensation plan that you feel would
encourage a restaurant manager to be more...
asked 35 minutes ago -
Re: Human Physiology
Comment on the differences between representing V02 max as an
absolute number and...
asked 37 minutes ago -
A firm with a WACC of 10% is considering the following mutually
exclusive projects:
0
1...
asked 42 minutes ago -
. A 100.0 mL sample of 0.18 M HClO4 is titrated with 0.27 M
LiOH. Determine...
asked 1 hour ago