Please show me what a subsidy does to a supply/demand graph and the DWL. I have a graph drawn but I do not know what it...
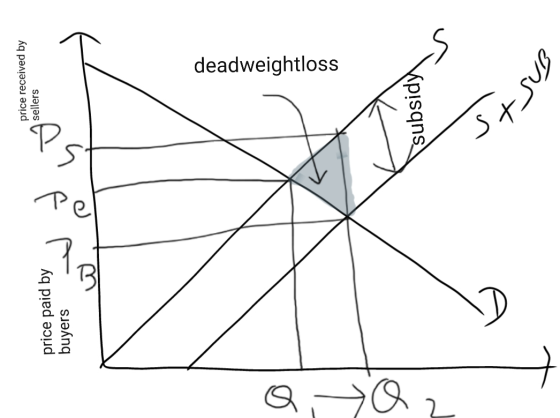
Please show me what a subsidy does to a supply/demand graph and the DWL. I have a graph drawn but I do not know what it actually means
Homework Answers
Ans) Subsidy is given by the government when it wants to encourage the production of something.
Subsidy increases the price received by the sellers and reduces the price paid by the buyers. That is it increases both consumer and producer surplus.


Add Answer to:
Please show me what a subsidy does to a supply/demand graph and the DWL. I have a graph drawn but I do not know what it...
Graph the supply and demand schedules for cappuchino…. please let me know what coordinates exactly. Suppose...
 Graph the supply and demand schedules for cappuchino…. please
let me know what coordinates exactly.
Suppose the market demand for a cup of cappuccino is given by Market for Cappuccino O 24 4P 10 and the market supply for a cup of cappuccino is given by Qs- 8P- 12, where P- price (per cup). Graph the supply and demand schedules for cappuccino. 1.) Using the line drawing tool, draw the demand curve for cappuccino. Label your line D 2.) Using...
Graph the supply and demand schedules for cappuchino…. please
let me know what coordinates exactly.
Suppose the market demand for a cup of cappuccino is given by Market for Cappuccino O 24 4P 10 and the market supply for a cup of cappuccino is given by Qs- 8P- 12, where P- price (per cup). Graph the supply and demand schedules for cappuccino. 1.) Using the line drawing tool, draw the demand curve for cappuccino. Label your line D 2.) Using...
A subsidy is a benefit given by the government to groups or individuals, usually in the...
A subsidy is a benefit given by the government to groups or individuals, usually in the form of cash payment or tax reduction to encourage production. We can think of a subsidy as a “negative” tax. Suppose the government gives producers a specific subsidy of $4 per unit. (35 points) Using supply and demand curves, draw a diagram that clearly shows what happens when the specific $4 subsidy is implemented. What price do sellers receive and what do the consumers...
Calculate DWL, please include formula The graph shows the market for corn with a price ceiling...
 Calculate DWL, please include formula
The graph shows the market for corn with a price ceiling of $7. Price After the price ceiling is in place, how many bushels of corn are bought or sold? Supply bushels 9.62 The market is not in equilibrium after the price ceiling is imposed. Rather, there is ashortage of how many bushels? Price ceiling 7.00 Demand 5.86 bushels 5 8.38 10.86 Quantity (bushels) What is the deadweight loss (DWL) resulting from the price ceiling?...
Calculate DWL, please include formula
The graph shows the market for corn with a price ceiling of $7. Price After the price ceiling is in place, how many bushels of corn are bought or sold? Supply bushels 9.62 The market is not in equilibrium after the price ceiling is imposed. Rather, there is ashortage of how many bushels? Price ceiling 7.00 Demand 5.86 bushels 5 8.38 10.86 Quantity (bushels) What is the deadweight loss (DWL) resulting from the price ceiling?...
Derive for me a hypothetical Demand and Supply schedule. Graph the relationship showing equilibrium price and...
Derive for me a hypothetical Demand and Supply schedule. Graph the relationship showing equilibrium price and quantity. Shift the demand curve and show the new equilibrium's. Shift the supply curve and do likewise. Can someone explain to me how to do this? Chapter wasn't clear
IMPORTANT: I know that I have a problem walkthrough and answers below, but there's a lot...
 IMPORTANT: I know that I have a problem walkthrough and answers
below, but there's a lot I don't get. Please help me with
this.
a) 1. I see how they got the price elasticity of demand
and how they got the equilibrium price AND quantity. However, I
don't see how they got the elasticity of demand AT the equilibrium
and quantity. Am I looking too much at the word usage or does the
"AND" and "AT" make a difference? If...
IMPORTANT: I know that I have a problem walkthrough and answers
below, but there's a lot I don't get. Please help me with
this.
a) 1. I see how they got the price elasticity of demand
and how they got the equilibrium price AND quantity. However, I
don't see how they got the elasticity of demand AT the equilibrium
and quantity. Am I looking too much at the word usage or does the
"AND" and "AT" make a difference? If...
Practice with supply and demand graph basics: please draw a fully labelled supply and demand graph...
Practice with supply and demand graph basics: please draw a fully labelled supply and demand graph that represents the market for nursing home care, per unit of care. In class we discussed shifters of supply and demand (and chp3 has further discussion). Next, assume that the price of home care services (is this a complement or substitute to nursing home care?) increases. To show that you understand the concept, please provide a fully labelled supply and demand graph, showing what...
5) (28 points) Suppose the demand and supply for flu shots are given by pd =...
 5) (28 points) Suppose the demand and supply for flu shots are given by pd = 1200-Q ps = 440 + Q Suppose flu shots generate a positive externality, and the marginal external benefit (MEB) is MEB=60 -0.050. (a) Derive the marginal social benefit (MSB) curve. (b) Draw the Demand, Supply, and MSB curves on the same graph (with P on the vertical axis and Q on the horizontal axis) and clearly indicate the curves in your graph. (c) Calculate...
iro ha 2. Show me what you know about bounded sequences! a) What does it mean...
 iro ha 2. Show me what you know about bounded sequences! a) What does it mean for a sequence to be bounded? Clearly state the definition using full sentences. A good start is, "A sequence {an) is bounded if and only if..." fra 10 b) Tell me in your own words what it means for a sequence to be bounded. Explain it as though I don't already know what this means, and you are teaching me. :) Ty
Supply and Demand v Given what you have learned about 1) demand (and its determinants) and...
 Supply and Demand v Given what you have learned about 1) demand (and its determinants) and quantity demanded and 2) supply (and its determinants) and quantity supplied work with your group members to analyze this hypothetical situation: There is a shortage of eggs. Consumers are substituting what they perceive to be "healthy" sandwich spreads for traditional mayonnaise. As a result, the makers of mayonnaise are introducing new sandwich spreads into the market The price of traditional mayonnaise is falling. Why?...
please help! aw a S Using an aggregate demand and supply graph, show and describe the...
 please help!
aw a S Using an aggregate demand and supply graph, show and describe the effects in both the short run and the long run of the following: 3. a. A temporary negative supply shock. b. A permanent negative supply shock
please help!
aw a S Using an aggregate demand and supply graph, show and describe the effects in both the short run and the long run of the following: 3. a. A temporary negative supply shock. b. A permanent negative supply shock
 Graph the supply and demand schedules for cappuchino…. please
let me know what coordinates exactly.
Suppose the market demand for a cup of cappuccino is given by Market for Cappuccino O 24 4P 10 and the market supply for a cup of cappuccino is given by Qs- 8P- 12, where P- price (per cup). Graph the supply and demand schedules for cappuccino. 1.) Using the line drawing tool, draw the demand curve for cappuccino. Label your line D 2.) Using...
Graph the supply and demand schedules for cappuchino…. please
let me know what coordinates exactly.
Suppose the market demand for a cup of cappuccino is given by Market for Cappuccino O 24 4P 10 and the market supply for a cup of cappuccino is given by Qs- 8P- 12, where P- price (per cup). Graph the supply and demand schedules for cappuccino. 1.) Using the line drawing tool, draw the demand curve for cappuccino. Label your line D 2.) Using...
 Calculate DWL, please include formula
The graph shows the market for corn with a price ceiling of $7. Price After the price ceiling is in place, how many bushels of corn are bought or sold? Supply bushels 9.62 The market is not in equilibrium after the price ceiling is imposed. Rather, there is ashortage of how many bushels? Price ceiling 7.00 Demand 5.86 bushels 5 8.38 10.86 Quantity (bushels) What is the deadweight loss (DWL) resulting from the price ceiling?...
Calculate DWL, please include formula
The graph shows the market for corn with a price ceiling of $7. Price After the price ceiling is in place, how many bushels of corn are bought or sold? Supply bushels 9.62 The market is not in equilibrium after the price ceiling is imposed. Rather, there is ashortage of how many bushels? Price ceiling 7.00 Demand 5.86 bushels 5 8.38 10.86 Quantity (bushels) What is the deadweight loss (DWL) resulting from the price ceiling?...
 IMPORTANT: I know that I have a problem walkthrough and answers
below, but there's a lot I don't get. Please help me with
this.
a) 1. I see how they got the price elasticity of demand
and how they got the equilibrium price AND quantity. However, I
don't see how they got the elasticity of demand AT the equilibrium
and quantity. Am I looking too much at the word usage or does the
"AND" and "AT" make a difference? If...
IMPORTANT: I know that I have a problem walkthrough and answers
below, but there's a lot I don't get. Please help me with
this.
a) 1. I see how they got the price elasticity of demand
and how they got the equilibrium price AND quantity. However, I
don't see how they got the elasticity of demand AT the equilibrium
and quantity. Am I looking too much at the word usage or does the
"AND" and "AT" make a difference? If...
 5) (28 points) Suppose the demand and supply for flu shots are given by pd = 1200-Q ps = 440 + Q Suppose flu shots generate a positive externality, and the marginal external benefit (MEB) is MEB=60 -0.050. (a) Derive the marginal social benefit (MSB) curve. (b) Draw the Demand, Supply, and MSB curves on the same graph (with P on the vertical axis and Q on the horizontal axis) and clearly indicate the curves in your graph. (c) Calculate...
 iro ha 2. Show me what you know about bounded sequences! a) What does it mean for a sequence to be bounded? Clearly state the definition using full sentences. A good start is, "A sequence {an) is bounded if and only if..." fra 10 b) Tell me in your own words what it means for a sequence to be bounded. Explain it as though I don't already know what this means, and you are teaching me. :) Ty
 Supply and Demand v Given what you have learned about 1) demand (and its determinants) and quantity demanded and 2) supply (and its determinants) and quantity supplied work with your group members to analyze this hypothetical situation: There is a shortage of eggs. Consumers are substituting what they perceive to be "healthy" sandwich spreads for traditional mayonnaise. As a result, the makers of mayonnaise are introducing new sandwich spreads into the market The price of traditional mayonnaise is falling. Why?...
 please help!
aw a S Using an aggregate demand and supply graph, show and describe the effects in both the short run and the long run of the following: 3. a. A temporary negative supply shock. b. A permanent negative supply shock
please help!
aw a S Using an aggregate demand and supply graph, show and describe the effects in both the short run and the long run of the following: 3. a. A temporary negative supply shock. b. A permanent negative supply shock
Most questions answered within 3 hours.
-
The average length of time between arrivals at a turnpike
toll-booth is 26 seconds. What is...
asked 54 minutes ago -
(a) A piston at 6.1 atm contains a gas that occupies a volume of
3.5 L....
asked 2 hours ago -
Please answer true or false. Words
cannot be changed or added in to make it true...
asked 2 hours ago -
An empty test tube weighs 15.923 grams. Then,
MgCl2•6H2O is added into the test tube. After...
asked 2 hours ago -
Assume memory access is 10 units of time and disk access is
10000 units of time....
asked 2 hours ago -
1. Are all good samples random?
2. Magazines often report surveys giving statistics such as “63%...
asked 2 hours ago -
Under all the various types of market structures, firms
must eventually earn some economic profits for...
asked 2 hours ago -
Consider the following fitness regime for a single locus trait
with two co-dominant alleles: w11 =...
asked 2 hours ago -
A large cable company reports the following.
80% of its customers subscribe to its cable TV...
asked 2 hours ago -
Please answer the question in brief.
Discuss the role of ERP in organizations. Are ERP tools...
asked 2 hours ago -
Discuss the pros and cons of collaborative software such
as SameTime. Does it increase productivity? What...
asked 2 hours ago -
Buying your in-laws a gift because it’s expected is
due to the ____________ motive of gift-giving....
asked 2 hours ago