

1 Teap X) VP(Y) Petrol TeTank TenInitial TPetrol Pr Hydrocarbons gn.) 0.7 12 24 5.1 21 4. 3 10. 4 14. 7 17.4 21 25. 5 28. 7 24 35. 6 39. 5 15 13 67 49. 7 16 15 16 16 31 31 16 16 15 30 30 16 16 17 17 30 24 18 16 20 16 15 28 24 18 17 16 28 16 27 15 15 19 18 19 19 16
Homework Answers


MINITAB
OUTPUT:
MTB > Regress;
SUBC> Response 'Hydrocarbons';
SUBC> Nodefault;
SUBC> Continuous 'Petrol Temp' 'Tank Temp' 'Initial Pressure'
'Petrol Pressure';
SUBC> Terms C1 C2 C3 C4;
SUBC> Constant;
SUBC> Unstandardized;
SUBC> Tmethod;
SUBC> Tanova;
SUBC> Tsummary;
SUBC> Tcoefficients;
SUBC> Tequation;
SUBC> TDiagnostics 0.
Regression Analysis: Hydrocarbons versus Petrol Temp, Tank Temp,
Initial Pres, Petrol Press
Analysis of Variance
Source DF Adj SS Adj MS F-Value P-Value
Regression 4 2507.38 626.844 79.04 0.000
Petrol Temp 1 0.64 0.641 0.08
0.778
Tank Temp 1 85.57 85.567 10.79
0.003
Initial Pressure 1 12.35 12.349 1.56
0.223
Petrol Pressure 1 68.53 68.525 8.64
0.007
Error 27 214.12 7.931
Total 31 2721.50
RULE: If p-value is less than alpha (alpha=0.05) , then we Reject H0 and conclude that the variable is Significant.
Here, Tank Temp (p-val=0.003) and Petrol Pressure (p-val=0.007) are significant components (variables) of the model.
Model Summary
S R-sq R-sq(adj) R-sq(pred)
2.81612 92.13% 90.97% 88.26%
Coefficients
Term Coef SE Coef T-Value P-Value VIF
Constant 7.28 3.16 2.30 0.029
Petrol Temp -0.048 0.169 -0.28 0.778 13.02
Tank Temp 0.404 0.123 3.28 0.003 4.48
Initial Pressure -0.534 0.428 -1.25 0.223 70.50
Petrol Pressure 1.186 0.404 2.94 0.007 58.78
|
Regression Equation Hydrocarbons = 7.28 - 0.048 Petrol Temp + 0.404 Tank Temp - 0.534 Initial Pressure + 1.186 Petrol Pressure |
Fits and Diagnostics for Unusual Observations
Obs Hydrocarbons Fit Resid Std Resid
18 46.00 44.82 1.18 0.60 X
23 31.00 36.49 -5.49 -2.27 R
26 37.00 31.24 5.76 2.15 R
R Large residual
X Unusual X
Prediction:
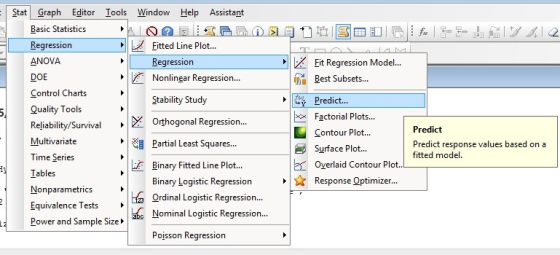

MTB > Predict 'Hydrocarbons';
SUBC> Nodefault;
SUBC> KPredictors 28 30 45 40;
SUBC> TEquation;
SUBC> TPrediction.
Prediction for Hydrocarbons
Regression Equation
Hydrocarbons = 7.28 - 0.048 Petrol Temp + 0.404 Tank Temp - 0.534
Initial Pressure
+ 1.186 Petrol Pressure
Variable Setting
Petrol Temp 28
Tank Temp 30
Initial Pressure 45
Petrol Pressure 40
Fit SE Fit 95% CI 95% PI
41.4836 2.39709 (36.5652, 46.4020) (33.8955,
49.0716) X
X denotes an unusual point relative to predictor levels used to fit the model.
Predicted amount of hydrocarbons is-
MTB > Let k1 = 7.28-0.048*28+0.404*30-0.534*45+1.186*40
MTB > print k1
Data Display
K1 41.4660
On comparing we observe that, we can be about 95 % confident in this prediction.
Add Answer to:
2. When petrol is pumped into tanks, hydrocarbons escape. To evaluate the effectiveness of pollution controls, exp...
2. When petrol is pumped into tanks, hydrocarbons escape. To evaluate the effectiveness of pollution controls...
 2. When petrol is pumped into tanks, hydrocarbons escape. To evaluate the effectiveness of pollution controls, experiments were performed. The quantity of hydrocarbons escaping was measured as a function of the tank temperature, the temperature of the petrol pumped in the initial pressure in the tank, and the pressure of the petrol pumped i a) The data is in the same data file as the previous question. Copy it into Minitab and run a regression analysis for the quantity of...
1. The operating characteristics of zinc-bromine batteries are partially dependent on the vapour pressure of the b...
 1. The operating characteristics of zinc-bromine batteries are partially dependent on the vapour pressure of the bromide compound, which is itself dependent on the temperature at which the battery operates. (a) In the data file RegressionTutorial.xlsx there are data of measurements of vapour pressure and the corresponding operating temperatures. Copy the data into Minitab and run a regression analysis. 1 mark for output (b) First perform an hypothesis test to see if there is a significant connection between the response...
Twenty-one daily responses of stack loss (y) (the amount of ammonia escaping) were measured with air...
Twenty-one daily responses of stack loss (y) (the amount of ammonia escaping) were measured with air flow x1, temperature x2, and acid concentration x3. Obtain a matrix plot of scatter plots for all pairs of variables using Minitab, and state your conclusion based on this graph. [5 marks] Find a multiple linear regression model for this data using Minitab. [5 marks] Check the significance of the model using ANOVA via Minitab and state your conclusion at 5% alpha level. [5...
The SAT and the ACT are the two major standardized tests that colleges use to evaluate candidates. Most students take ju...
The SAT and the ACT are the two major standardized tests that colleges use to evaluate candidates. Most students take just one of these tests. However, some students take both. The data data42.datgives the scores of 60 students who did this. How can we relate the two tests? (a) Plot the data with SAT on the x axis and ACT on the y axis. Describe the overall pattern and any unusual observations. (b) Find the least-squares regression line and draw...
Game Point_Differential Assists Rebounds Turnovers Personal_Fouls 1 15 15 38 11 9 2 36 20 43 &
 Game
Point_Differential Assists
Rebounds Turnovers Personal_Fouls
1 15 15 38
11 9
2 36 20 43
8 13
3 16 21 29
7 13
4 45 22 46
11 11
5 12 11 40
7 22
6 -10 10 31
13 26
7 11 19 45
11 7
8 12 16 32
16 14
9 3 16 27
18 15
10 19 9 34
17 17
11 40 16 41
9 17
12 44 12 29
9 22
13 16 ...
Game
Point_Differential Assists
Rebounds Turnovers Personal_Fouls
1 15 15 38
11 9
2 36 20 43
8 13
3 16 21 29
7 13
4 45 22 46
11 11
5 12 11 40
7 22
6 -10 10 31
13 26
7 11 19 45
11 7
8 12 16 32
16 14
9 3 16 27
18 15
10 19 9 34
17 17
11 40 16 41
9 17
12 44 12 29
9 22
13 16 ...
The SAT and the ACT are the two major standardized tests that colleges use to evaluate...
The SAT and the ACT are the two major standardized tests that colleges use to evaluate candidates. Most students take just one of these tests. However, some students take both. The data gives the scores of 60 students who did this. How can we relate the two tests? (a) Plot the data with SAT on the x axis and ACT on the y axis. Describe the overall pattern and any unusual observations. (b) Find the least-squares regression line and draw...
1. You are the new data scientist for Fitbit. When viewing the Google Analytics account associate...
 1. You are the new data scientist for Fitbit.
When viewing the Google Analytics account associated with the
Fitbit website., you notice that the Average Time on Site is 82
seconds.
- Describe 4 different ways you can provide context for this
metric.
- For the sub-activity, refer to the attachment below entitled,
"Image_Module_11.jpg" (the image is also embedded within the text
below). Imagine that you have created an email campaign designed to
drive users to your site. The email...
1. You are the new data scientist for Fitbit.
When viewing the Google Analytics account associated with the
Fitbit website., you notice that the Average Time on Site is 82
seconds.
- Describe 4 different ways you can provide context for this
metric.
- For the sub-activity, refer to the attachment below entitled,
"Image_Module_11.jpg" (the image is also embedded within the text
below). Imagine that you have created an email campaign designed to
drive users to your site. The email...
The SAT and the ACT are the two major standardized tests that colleges use to evaluate...
The SAT and the ACT are the two major standardized tests that colleges use to evaluate candidates. Most students take just one of these tests. However, some students take both. The data data432.dat gives the scores of 60 students who did this. How can we relate the two tests? (a) Plot the data with SAT on the x axis and ACT on the y axis. Describe the overall pattern and any unusual observations. (b) Find the least-squares regression line and...
An article in Technometrics (1974, Vol. 16, pp. 523-531) considered the following stack-loss data from a...
 An article in Technometrics (1974, Vol. 16, pp. 523-531) considered the following stack-loss data from a plant oxidizing ammonia to nitric acid. Twenty-one daily responses of stack loss (the amount of ammonia escaping) were measured with air flow X1, temperature x2, and acid concentration x3. y 21 .22 X3 42 80 27 89 37 80 27 88 37 75 25 90 28 62 24 87 18 62 22 87 18 62 23 87 62 24 93 19 20 62 24...
Reserve Problems Chapter 12 Section 1 Problem 11 An article in Technometrics (1974, Vol. 16, pp....
 Reserve Problems Chapter 12 Section 1 Problem 11 An article in Technometrics (1974, Vol. 16, pp. 523-531) considered the following stack-loss data from a plant oxidizing ammonia to nitric acid. Twenty-one daily responses of stack loss (the amount of ammonia escaping) were measured with air flow X1, temperature x2, and acid concentration X3. y 42 80 27 89 37 80 27 88 37 75 25 90 28 62 24 87 18 62 22 87 18 62 23 87 19 62...
 2. When petrol is pumped into tanks, hydrocarbons escape. To evaluate the effectiveness of pollution controls, experiments were performed. The quantity of hydrocarbons escaping was measured as a function of the tank temperature, the temperature of the petrol pumped in the initial pressure in the tank, and the pressure of the petrol pumped i a) The data is in the same data file as the previous question. Copy it into Minitab and run a regression analysis for the quantity of...
 1. The operating characteristics of zinc-bromine batteries are partially dependent on the vapour pressure of the bromide compound, which is itself dependent on the temperature at which the battery operates. (a) In the data file RegressionTutorial.xlsx there are data of measurements of vapour pressure and the corresponding operating temperatures. Copy the data into Minitab and run a regression analysis. 1 mark for output (b) First perform an hypothesis test to see if there is a significant connection between the response...
 Game
Point_Differential Assists
Rebounds Turnovers Personal_Fouls
1 15 15 38
11 9
2 36 20 43
8 13
3 16 21 29
7 13
4 45 22 46
11 11
5 12 11 40
7 22
6 -10 10 31
13 26
7 11 19 45
11 7
8 12 16 32
16 14
9 3 16 27
18 15
10 19 9 34
17 17
11 40 16 41
9 17
12 44 12 29
9 22
13 16 ...
Game
Point_Differential Assists
Rebounds Turnovers Personal_Fouls
1 15 15 38
11 9
2 36 20 43
8 13
3 16 21 29
7 13
4 45 22 46
11 11
5 12 11 40
7 22
6 -10 10 31
13 26
7 11 19 45
11 7
8 12 16 32
16 14
9 3 16 27
18 15
10 19 9 34
17 17
11 40 16 41
9 17
12 44 12 29
9 22
13 16 ...
 1. You are the new data scientist for Fitbit.
When viewing the Google Analytics account associated with the
Fitbit website., you notice that the Average Time on Site is 82
seconds.
- Describe 4 different ways you can provide context for this
metric.
- For the sub-activity, refer to the attachment below entitled,
"Image_Module_11.jpg" (the image is also embedded within the text
below). Imagine that you have created an email campaign designed to
drive users to your site. The email...
1. You are the new data scientist for Fitbit.
When viewing the Google Analytics account associated with the
Fitbit website., you notice that the Average Time on Site is 82
seconds.
- Describe 4 different ways you can provide context for this
metric.
- For the sub-activity, refer to the attachment below entitled,
"Image_Module_11.jpg" (the image is also embedded within the text
below). Imagine that you have created an email campaign designed to
drive users to your site. The email...
 An article in Technometrics (1974, Vol. 16, pp. 523-531) considered the following stack-loss data from a plant oxidizing ammonia to nitric acid. Twenty-one daily responses of stack loss (the amount of ammonia escaping) were measured with air flow X1, temperature x2, and acid concentration x3. y 21 .22 X3 42 80 27 89 37 80 27 88 37 75 25 90 28 62 24 87 18 62 22 87 18 62 23 87 62 24 93 19 20 62 24...
 Reserve Problems Chapter 12 Section 1 Problem 11 An article in Technometrics (1974, Vol. 16, pp. 523-531) considered the following stack-loss data from a plant oxidizing ammonia to nitric acid. Twenty-one daily responses of stack loss (the amount of ammonia escaping) were measured with air flow X1, temperature x2, and acid concentration X3. y 42 80 27 89 37 80 27 88 37 75 25 90 28 62 24 87 18 62 22 87 18 62 23 87 19 62...
Most questions answered within 3 hours.
-
Considering gravitational time dilation, calculate the time that
passes in Earth’s surface while 1 hour passes...
asked 15 minutes ago -
Minitab Problem: Take the Lake Hume June rainfall data and find
use the processes outlined in...
asked 1 hour ago -
X Company is trying to decide whether to continue using old
equipment to make Product A...
asked 1 hour ago -
IN PYTHON ONLY !! Program 2: Re-work
program #5 (WeeklyHours) from the previous assignment such that...
asked 1 hour ago -
The average length of time between arrivals at a turnpike
toll-booth is 26 seconds. What is...
asked 3 hours ago -
(a) A piston at 6.1 atm contains a gas that occupies a volume of
3.5 L....
asked 4 hours ago -
Please answer true or false. Words
cannot be changed or added in to make it true...
asked 4 hours ago -
An empty test tube weighs 15.923 grams. Then,
MgCl2•6H2O is added into the test tube. After...
asked 4 hours ago -
Assume memory access is 10 units of time and disk access is
10000 units of time....
asked 4 hours ago -
1. Are all good samples random?
2. Magazines often report surveys giving statistics such as “63%...
asked 5 hours ago -
Under all the various types of market structures, firms
must eventually earn some economic profits for...
asked 5 hours ago -
Consider the following fitness regime for a single locus trait
with two co-dominant alleles: w11 =...
asked 5 hours ago