
Homework Answers

MATLAB code is given below to plot the magnitude response.
code:
clc;
close all;
clear all;
% define range of w from -pi to pi
w = -pi:0.01:pi;
% define H(w)
H = (2*exp(1j*w)+4.75)./(exp(2j*w)-0.2);
% Now plot the magnitude spectrum
figure;
plot(w/pi,abs(H),'linewidth',2);grid
on;xlabel('w/\pi');ylabel('Magnitude');title('|H(w)|');
Response:

Add Answer to:
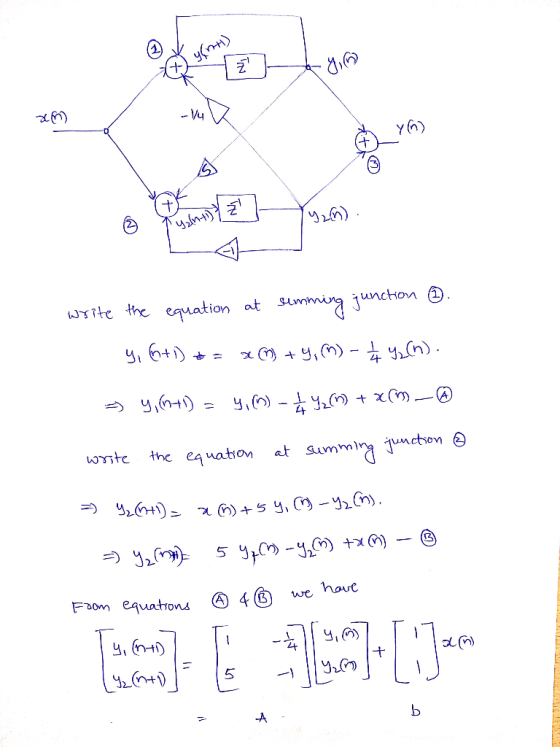
4.27) For the following system: 1/4 x(n) a. Find A, b, g, d. b. Find H(z), and the pole/zero plot. c. Sketch H() 4...
For x[n]-(0.3). 1. a. (2 pts) Find the z-transform, X(z b. (3 pts) Sketch the pole-zero...
 For x[n]-(0.3). 1. a. (2 pts) Find the z-transform, X(z b. (3 pts) Sketch the pole-zero plot. c. (3 pts) Find the region of convergence of the transform. Sketch it in the z-plane. d. (3 pts) Use your answer in part a to write down the DTFT of x,[n]=(0.3)"u[n]. Why is it necessary to multiply by the unit step function to get the DTFT?
Let x(n) be the sequence with the pole-zero plot . Sketch the pole –zero plot for...
Let x(n) be the sequence with the pole-zero plot . Sketch the pole –zero plot for y(n)= (1/2)n x(n)
Given a system with pole zero plot shown in Figure 4-37 and the fact that H(0)...
 Given a system with pole zero plot shown in Figure 4-37 and the fact that H(0) = -5 Im{z} 2 1 -0.5 2 Re{z} 0 -1 -2 -2 -1 0 2 Figure 4-37 a) Find h[n] given that the system is causal b) Find h[n] given that the system is stable.
2. Consider a second IIR filter a. Determine the system function H(z), pole-zero location (patterns), and plot the pole-zero pattern. b. Determine the analytical expression for frequency response...
 2. Consider a second IIR filter a. Determine the system function H(z), pole-zero location (patterns), and plot the pole-zero pattern. b. Determine the analytical expression for frequency response, magnitude, and phase response. c. Choose b so that the maximum magnitude response is equal to 1. d. Plot the pole-zero pattern and the magnitude of the frequency response as a function of normal frequency.
2. Consider a second IIR filter a. Determine the system function H(z), pole-zero location (patterns), and plot...
2. Consider a second IIR filter a. Determine the system function H(z), pole-zero location (patterns), and plot the pole-zero pattern. b. Determine the analytical expression for frequency response, magnitude, and phase response. c. Choose b so that the maximum magnitude response is equal to 1. d. Plot the pole-zero pattern and the magnitude of the frequency response as a function of normal frequency.
2. Consider a second IIR filter a. Determine the system function H(z), pole-zero location (patterns), and plot...
3. (Oppenheim Willsky) Determine the z-transform for each of the following sequences. Sketch the pole-zero plot...
 3. (Oppenheim Willsky) Determine the z-transform for each of the following sequences. Sketch the pole-zero plot and indicate the region of convergence. Indicate whether or not the discrete-time Fourier transform of the sequence exists. (a) 8[n +5] (b) (-1)"u[n] (c) (-3)”u[-n – 2] (d) 27u[n] +(4)”u[n – 1]
Problem #1. Topics: Z Transform Find the Z transform of: x[n]=-(0.9 )n-2u-n+5] X(Z) Problem #2. T...
 Problem #1. Topics: Z Transform Find the Z transform of: x[n]=-(0.9 )n-2u-n+5] X(Z) Problem #2. Topics: Filter Design, Effective Time Constant Design a causal 2nd order, normalized, stable Peak Filter centered at fo 1000Hz. Use only two conjugate poles and two zeros at the origin. The system is to be sampled at Fs- 8000Hz. The duration of the transient should be as close as possible to teft 7.5 ms. The transient is assumed to end when the largest pole elevated...
Find Z tranform and ROC; Sketch pole zero x[n]=(2/3)^n u[-n-1]+(-(1/3))^n u[n]
Find Z tranform and ROC; Sketch pole zero x[n]=(2/3)^n u[-n-1]+(-(1/3))^n u[n]
an LTI causal system a) find pole and zero system and plot in the s field...
 an LTI causal system
a) find pole and zero system and plot in the s
field
b) find ROC
c&d)
G) sstem LTI Kausal x (s) HUss (2) (s+s) c) Find tfor x (t) - Lt)
an LTI causal system
a) find pole and zero system and plot in the s
field
b) find ROC
c&d)
G) sstem LTI Kausal x (s) HUss (2) (s+s) c) Find tfor x (t) - Lt)
I (K Pole-Zero Plot #1 Pole-Eero Plot 15 L. Pole-Zero Plot IMI 4z1 15 Prde-Zero Plot...
 I (K Pole-Zero Plot #1 Pole-Eero Plot 15 L. Pole-Zero Plot IMI 4z1 15 Prde-Zero Plot #5 Pole-Zero Plat #6 Tine Index (n) Problem P-10.20. Match a pole-zero plot (1-6) to each of the impulse response plots (J-N) shown above (Figure P-10.20 from p. 464) Note: Beach Board causes the magnitude Impulse Response Plot number order to be in random order Pole-Zero Plot #1 Pole-Zero Plot #2 Pole-Zero Plot #3 1, hin] Plot (N) hin] Plot (K) h[n] Plot (M)...
(2) (10 points) Consider a causal LTI system which its zero-pole plot of H(z) is shown...
 (2) (10 points) Consider a causal LTI system which its zero-pole plot of H(z) is shown in Fig. 1 2. Suppose it is known that lim h[n]= 1) Determine the h[n] of the system. 2) Determine the difference equation of this system. jim (z) 3) Draw the the Block Diagram of this system. -1/3 Re (z) 2 Fig. 2
 For x[n]-(0.3). 1. a. (2 pts) Find the z-transform, X(z b. (3 pts) Sketch the pole-zero plot. c. (3 pts) Find the region of convergence of the transform. Sketch it in the z-plane. d. (3 pts) Use your answer in part a to write down the DTFT of x,[n]=(0.3)"u[n]. Why is it necessary to multiply by the unit step function to get the DTFT?
 Given a system with pole zero plot shown in Figure 4-37 and the fact that H(0) = -5 Im{z} 2 1 -0.5 2 Re{z} 0 -1 -2 -2 -1 0 2 Figure 4-37 a) Find h[n] given that the system is causal b) Find h[n] given that the system is stable.
 2. Consider a second IIR filter a. Determine the system function H(z), pole-zero location (patterns), and plot the pole-zero pattern. b. Determine the analytical expression for frequency response, magnitude, and phase response. c. Choose b so that the maximum magnitude response is equal to 1. d. Plot the pole-zero pattern and the magnitude of the frequency response as a function of normal frequency.
2. Consider a second IIR filter a. Determine the system function H(z), pole-zero location (patterns), and plot...
2. Consider a second IIR filter a. Determine the system function H(z), pole-zero location (patterns), and plot the pole-zero pattern. b. Determine the analytical expression for frequency response, magnitude, and phase response. c. Choose b so that the maximum magnitude response is equal to 1. d. Plot the pole-zero pattern and the magnitude of the frequency response as a function of normal frequency.
2. Consider a second IIR filter a. Determine the system function H(z), pole-zero location (patterns), and plot...
 3. (Oppenheim Willsky) Determine the z-transform for each of the following sequences. Sketch the pole-zero plot and indicate the region of convergence. Indicate whether or not the discrete-time Fourier transform of the sequence exists. (a) 8[n +5] (b) (-1)"u[n] (c) (-3)”u[-n – 2] (d) 27u[n] +(4)”u[n – 1]
 Problem #1. Topics: Z Transform Find the Z transform of: x[n]=-(0.9 )n-2u-n+5] X(Z) Problem #2. Topics: Filter Design, Effective Time Constant Design a causal 2nd order, normalized, stable Peak Filter centered at fo 1000Hz. Use only two conjugate poles and two zeros at the origin. The system is to be sampled at Fs- 8000Hz. The duration of the transient should be as close as possible to teft 7.5 ms. The transient is assumed to end when the largest pole elevated...
 an LTI causal system
a) find pole and zero system and plot in the s
field
b) find ROC
c&d)
G) sstem LTI Kausal x (s) HUss (2) (s+s) c) Find tfor x (t) - Lt)
an LTI causal system
a) find pole and zero system and plot in the s
field
b) find ROC
c&d)
G) sstem LTI Kausal x (s) HUss (2) (s+s) c) Find tfor x (t) - Lt)
 I (K Pole-Zero Plot #1 Pole-Eero Plot 15 L. Pole-Zero Plot IMI 4z1 15 Prde-Zero Plot #5 Pole-Zero Plat #6 Tine Index (n) Problem P-10.20. Match a pole-zero plot (1-6) to each of the impulse response plots (J-N) shown above (Figure P-10.20 from p. 464) Note: Beach Board causes the magnitude Impulse Response Plot number order to be in random order Pole-Zero Plot #1 Pole-Zero Plot #2 Pole-Zero Plot #3 1, hin] Plot (N) hin] Plot (K) h[n] Plot (M)...
 (2) (10 points) Consider a causal LTI system which its zero-pole plot of H(z) is shown in Fig. 1 2. Suppose it is known that lim h[n]= 1) Determine the h[n] of the system. 2) Determine the difference equation of this system. jim (z) 3) Draw the the Block Diagram of this system. -1/3 Re (z) 2 Fig. 2
Most questions answered within 3 hours.
-
Subject: C++
I have created a class called QueueOfIntegers in a file called
QueueOfIntegers.h, which is...
asked 43 seconds from now -
You are trying to convince your friend who wants to attend
medical school to take BY123...
asked 22 seconds from now -
calculate the number of molecules of gas in a
container of 2.0 liter at 30 degrees...
asked 16 minutes ago -
1.which of the following is a phototroph?
a. sulfolobus
b. chloroflexus
c. bacteroidetes
d. deinococcus radioduran...
asked 12 minutes ago -
The group of companies LC "High-precision measuring instruments"
is the global provider of measurement, analysis and...
asked 18 minutes ago -
I want to write a python function to find the minimum
I have an nested list:...
asked 18 minutes ago -
Convert the high level language programming statementts to 80x86
assembly, Assume X=AX and y=BX
for (i=1;...
asked 28 minutes ago -
SoleMate’s Burkins sneakers cost $40 per pair from the supplier
and are sold by SoleMate at...
asked 32 minutes ago -
The movie Moneyball (based on the book by Michael
Lewis) tells the story of Billy Beane,...
asked 31 minutes ago -
A regional highway uses 8 tollbooths that are open to all
vehicles. A chi-square goodness-of-fit test...
asked 34 minutes ago -
In her Semiannual Monetary Policy Report to Congress on July 13,
2017, then Federal Reserve Chair...
asked 33 minutes ago -
Suppose N packets are sent,
and each packet arrives at rate of L/2R to a link....
asked 52 minutes ago