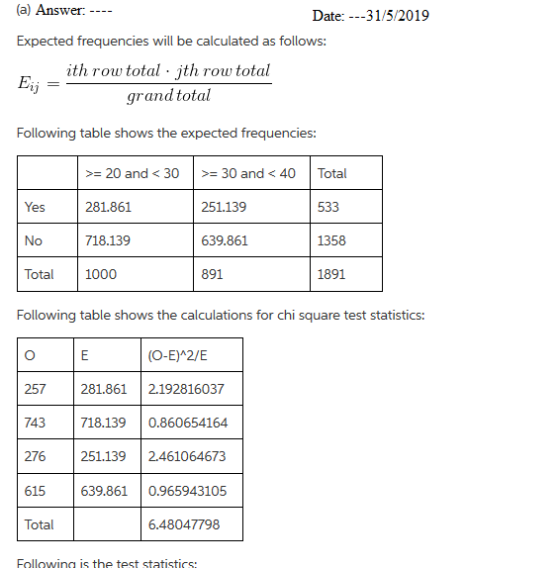
A study was done to determine whether the proportion of younger adults who subscribe to a traditional TV service (Comcas...
A study was done to determine whether the proportion of younger adults who subscribe to a traditional TV service (Comcast, DirecTV, Dish, etc.) differs according to age. The results are summarized in the following table:
|
Age |
|||
|
Traditional TV? |
>= 20 and < 30 |
>= 30 and < 40 |
Total |
|
Yes |
257 |
276 |
533 |
|
No |
743 |
615 |
1358 |
|
Total |
1000 |
891 |
1891 |
-
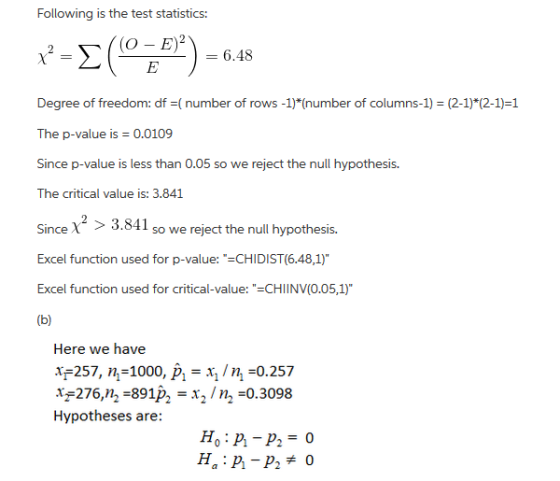
(a) At the .05 level of significance, use a 2-test to see if the sample data provides evidence that the proportion who subscribe to traditional TV is different for the two age groups considered. Perform your test using both the critical value and p-value approach.
-
(b) When only two proportions are involved, as is the case here, there is an equivalent two-sided z-test for testing the question posed in Part (a). This test is presented in text Section 10.3 (optional reading, shouldn’t be necessary to answer this question).Use software to generate the z-statistic for comparing two proportions and perform the test using both the critical value and p-value approach. Use the version of the test in Minitab (see ‘Options/Test Method’) that works with a ‘pooled estimate’ ofthe population proportion.
Then verify that the 2-stat from Part (a) is the square of the z-stat (give or taking rounding), that the critical 2 value from Part (a) is the square of the critical z value, and that both statistics have the same p-values.
Homework Answers


Add Answer to:
A study was done to determine whether the proportion of younger adults who subscribe to a traditional TV service (Comcas...
A study was conducted to determine the proportion of people who dream in black and white...
 A study was conducted to determine the proportion of people who dream in black and white instead of color. Among 318 people over the age of 55, 79 dream in black and white, and among 314 people under the age of 25, 13 dream in black and white. Use a 0.05 significance level to test the claim that the proportion of people over 55 who dream in black and white is greater than the proportion for those under 25. Complete...
A study was conducted to determine the proportion of people who dream in black and white...
 A study was conducted to determine the proportion of people who dream in black and white instead of color. Among 324 people over the age of 55, 72 dream in black and white, and among 296 people under the age of 25, 18 dream in black and white. Use a 0.01 significance level to test the claim that the proportion of people over 55 who dream in black and white is greater than the proportion for those under 25. Complete...
Question Help Instructor-created question A study was conducted to determine the proportion of people who dream...
 Question Help Instructor-created question A study was conducted to determine the proportion of people who dream in black and white instead of color Among 304 people over the age of 55, 64 dream in black and white, and among 282 people under the age of 25, 13 dream in black and White. Use a 0.05 significance level to test the claim that the proportion of people over 55 who dream in black and white is greater than the proportion for...
Using the accompanying data below, perform a chi-square test using alphaαequals=0.01 to determine if the proportion...
Using the accompanying data below, perform a chi-square test using alphaαequals=0.01 to determine if the proportion of "Yes" observations differs between Populations A and B. Observed frequencies: Population Yes No A 18 20 B 22 20 Expected frequencies: Population Yes No A 19 19 B 21 21 Click the icon to view an excerpt from the table of chi-square critical values. What are the null and alternative hypotheses? A. Upper H 0H0: p Subscript Upper A Baseline not equals p...
Problem: Proportion of "Cured” Cancer Patients: How Does Canada Compare with Europe? Lung cancer remains the...
 Problem: Proportion of "Cured” Cancer Patients: How Does Canada Compare with Europe? Lung cancer remains the leading cause of cancer death for both Canadian men and women, responsible for the most potential years of life lost to cancer. Lung cancer alone accounts for 28% of all cancer deaths in Canada (32%. in Quebec). Most forms of lung cancer start insidiously and produce no apparent symptoms until they are too far advanced. Consequently, the chances of being cured of lung cancer...
A real estate research firm has developed a regression model relating list price (Y in 1,000)...
 A real estate research firm has developed a regression model relating list price (Y in 1,000) with two independent variables. The two independent variables are number of bedrooms and size of the property. Part of the regression results are shown below. ANOVA MS Regression 256881.37 128440.68 Residual 42 726699.96 17302.38 Coefficients Standard Error Star Intercept 54.298 # Bedrooms 53.634 71.326 5.271 33.630 Acres 21.458 1. What has been the sample size? (2 Points) 2. What is the value of the...
 A study was conducted to determine the proportion of people who dream in black and white instead of color. Among 318 people over the age of 55, 79 dream in black and white, and among 314 people under the age of 25, 13 dream in black and white. Use a 0.05 significance level to test the claim that the proportion of people over 55 who dream in black and white is greater than the proportion for those under 25. Complete...
 A study was conducted to determine the proportion of people who dream in black and white instead of color. Among 324 people over the age of 55, 72 dream in black and white, and among 296 people under the age of 25, 18 dream in black and white. Use a 0.01 significance level to test the claim that the proportion of people over 55 who dream in black and white is greater than the proportion for those under 25. Complete...
 Question Help Instructor-created question A study was conducted to determine the proportion of people who dream in black and white instead of color Among 304 people over the age of 55, 64 dream in black and white, and among 282 people under the age of 25, 13 dream in black and White. Use a 0.05 significance level to test the claim that the proportion of people over 55 who dream in black and white is greater than the proportion for...
 Problem: Proportion of "Cured” Cancer Patients: How Does Canada Compare with Europe? Lung cancer remains the leading cause of cancer death for both Canadian men and women, responsible for the most potential years of life lost to cancer. Lung cancer alone accounts for 28% of all cancer deaths in Canada (32%. in Quebec). Most forms of lung cancer start insidiously and produce no apparent symptoms until they are too far advanced. Consequently, the chances of being cured of lung cancer...
 A real estate research firm has developed a regression model relating list price (Y in 1,000) with two independent variables. The two independent variables are number of bedrooms and size of the property. Part of the regression results are shown below. ANOVA MS Regression 256881.37 128440.68 Residual 42 726699.96 17302.38 Coefficients Standard Error Star Intercept 54.298 # Bedrooms 53.634 71.326 5.271 33.630 Acres 21.458 1. What has been the sample size? (2 Points) 2. What is the value of the...
Most questions answered within 3 hours.
-
Walgreen Company (NYSE: WAG) is currently trading at $48.50 on
the NYSE. Walgreen Company is also...
asked 2 minutes ago -
Based on historical data, your team knows what proportion of the
company's orders come from Males...
asked 20 minutes ago -
8. Which of the following atoms has the largest magnitude
electron affinity?
(a) Sodium (Na)
(b)...
asked 23 minutes ago -
Assess the two types of tests of cognitive abilities. (
regarding HR course)
asked 27 minutes ago -
1.Write an inspiring vision statement for an organization where
you work or have worked. If the...
asked 29 minutes ago -
2. Is fair trade coffee sustainable for the mass market,
or is it a niche product...
asked 29 minutes ago -
Please answer this asap in MATLAB.
In the following for loop, the the loop is executed...
asked 42 minutes ago -
A 50.0-g golf ball is driven from the tee with an initial speed
of 44.6 m/s...
asked 37 minutes ago -
Use the molar concentration of the 50 mL solution to calculate
the moles of Cr(III) in...
asked 39 minutes ago -
Calculate the molarity of Fe3+ in solution A.
Solution A: 10 mL of 0.0600 M Fe(No3)3 ...
asked 48 minutes ago -
two dogs pull 2 strings horizontally which are tied to a sleigh.
the angle between the...
asked 48 minutes ago -
please write a paper about any ethical violation based on the
case study Stanford's Prison Experiment....
asked 1 hour ago