


Write a brief description in which you outline how you would obtain a random sample of 102 West Texas water wells. Explain how random numbers would be used In the selection process O One could assign consecutive numbers to each well in West Texas and then use a random number table or a computer package to draw the simple random sample. 。One could assign consecutive numbers to each well in Texas and then use a random number table or a computer package to (hw the simple random sample. O One could assign consecutive numbers to each well in several neighborhoods of Texas and then use a random number table or a computer package to draw the simple random sample. O One could assign consecutive numbers to each well in the most rural areas of West Texas and then use a random number table or a computer package to draw the simple random sample. O One could assign consecutive numbers to each well in one neighborhood of West Texas and then use a random number table or a computer package to draw the simple random sample.
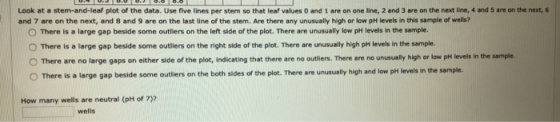
Look at a stem-and-leaf plot of the data. Use five lines per stem so that leaf values 0 and 1 are on one line, 2 and 3 are on the next line, 4 and 5 are on the next, 6 and 7 are on the next, and 8 and 9 are on the last line of the stem. Are there any unusually high or low pH levels in this sample of wells? There is a large gap beside some outliers on the left side of the plot. There are unusually low pH levels n the sample. O There is a large gap beside some outliers on the right side of the plot. There are unusually high pH levels in the sample. There are no large gaps on either side of the plot, indicating that there are no outlers. There are no unusualy high or low pH levels n the sample gap beside some outliers on the both sides of the plot. There are unusually high and low pH levels In the sample. How many wells are neutral (pH of 7) wells
Look at a histogram of the data using five classes. Is the pH distribution for these wells symmetric or skewed? O symmetric O skewed right skewed left Are lower or higher values more common? O lower values are more common O higher values are more common O lower and higher values are equally common
Homework Answers
A) The given data is in interval scale.
C) Interval is correct
b) The data can be arranged in order, the difference has a meaning but there is not a true zero of pH.
Hence, A) is correct.
c) To obtain random samples, A) is correct where we assign consecutive numbers to each well in West Texas and then use a random number table.
d) 8 wells are neutral
e) The stem and leaf plot is not shown but there are some outliers on right side of the plot. Unusual high pH values like 8.7, 8.8 etc.B is correct.
f) The histogram is skewed right as most of the values have low pH which can be observed from the data.
B) skewed right is correct
g) lower values are more common. A) is correct
Add Answer to:
In West Texas, water is extremely important. The following data represent pH levels in ground water for a random...
In West Texas, water is extremely important. The following data represent ph levels in ground water...
 In West Texas, water is extremely important. The following data represent ph levels in ground water for a random sample of 102 West Texas wells. A pH less than 7 Is adidic and a pH above 7 is alkaline. Scanning the data, you can see that water in this region tends to be hard (alkaline). Too high a pH means the water is unusable or needs expensive treatment to make it usable.t These data are also available for download at...
In West Texas, water is extremely important. The following data represent pH levels in ground water...
 In West Texas, water is extremely important. The following data
represent pH levels in ground water for a random sample of 102 West
Texas wells. A pH less than 7 is acidic and a pH above 7 is
alkaline. Scanning the data, you can see that water in this region
tends to be hard (alkaline). Too high a pH means the water is
unusable or needs expensive treatment to make it usable.† These
data are also available for download at...
In West Texas, water is extremely important. The following data
represent pH levels in ground water for a random sample of 102 West
Texas wells. A pH less than 7 is acidic and a pH above 7 is
alkaline. Scanning the data, you can see that water in this region
tends to be hard (alkaline). Too high a pH means the water is
unusable or needs expensive treatment to make it usable.† These
data are also available for download at...
x: pH of Ground Water in 102 West Texas Wells 7.5 8.2 7.4 7.3 7.5 7.6...
x: pH of Ground Water in 102 West Texas Wells 7.5 8.2 7.4 7.3 7.5 7.6 7.9 7.7 7.8 7.0 7.6 7.9 7.7 8.2 7.4 7.6 7.4 7.6 7.2 7.1 7.3 7.2 7.4 7.5 7.9 8.2 7.4 7.2 7.5 7.2 7.3 7.0 7.2 7.3 7.3 7.2 7.3 7.0 8.4 7.7 7.6 7.7 7.5 7.8 7.2 7.6 8.1 7.9 7.4 8.1 8.6 7.3 8.2 7.7 8.0 7.0 8.2 7.1 7.5 8.2 7.2 7.9 8.5 7.2 7.1 7.0 7.8 7.3 7.3 7.4...
4. A n experiment was set up to compare the effect of different soil pH and calcium additives on ...
 4. A n experiment was set up to compare the effect of different soil pH and calcium additives on the increase in trunk diameters for orange trees. Annual applications of elemental sulfur, gypsum, soda ash, and other ingredients were applied to provide pH value levels of 4, 5, 6, and 7. Three levels of a calcium supplement (100, 200, and 300 pounds per acre) were also applied. All factor-level combinations of these two variables were used in the experiment. At...
Customer Waiting Times (in minutes) 7.4 6.9 6.9 6.8 7.4 6.6 7.7 6.5 7.2 7.9 8.7...
 Customer Waiting Times (in minutes) 7.4 6.9 6.9 6.8 7.4 6.6 7.7 6.5 7.2 7.9 8.7 7.2 7.4 7.9 6.9 6.7 8.9 7.1 7.6 6.1 7.2 7.6 7.3 5.9 7.3 6.8 6.7 6.9 7.8 7.4 6.8 6.9 6.1 6.4 5.3 7.7 7.7 7.8 7.5 6.3 7.6 7.1 6.9 8.7 7.4 6.4 6.8 7.2 8.6 6.1 7.1 6.7 7.5 7.6 7.1 8.1 7.3 7.5 7.8 6.3 The accompanying data table includes weights (in grams) of a simple random sample of 40...
The data table contains waiting times of customers at a bank, where customers enter a single...
The data table contains waiting times of customers at a bank, where customers enter a single waiting line that feeds three teller windows. Test the claim that the standard deviation of waiting times is less than 2.4 minutes, which is the standard deviation of waiting times at the same bank when separate waiting lines are used at each teller window. Use a significance level of 0.01. Complete parts (a) through (d) below. Customer Waiting Times (in minutes) 7.5 6.5 9.2...
In the proton NMR for benzil, there are clearly some impurity peaks below 8 ppm. Although...
 In the proton NMR for benzil, there are clearly some impurity
peaks below 8 ppm. Although we cannot assign these for certain, is
it possible that these peaks come from unreacted benzoin? Why or
why not?
8.0 8.3 7.5 8.2 NMR nuclei observed: H Solvent: CDCl3 NMR field strength: 400MHz 7.0 6.5 6.0 5.5 5.0 4.5 4.0 3.5 3.0 2.5 (ppm) f1 8.1 8.0 7.9 7.8 7.7 7.6 7.5 7.4 7.3 f1 (ppm) 11 10 12 13 14 2.0 1.5...
In the proton NMR for benzil, there are clearly some impurity
peaks below 8 ppm. Although we cannot assign these for certain, is
it possible that these peaks come from unreacted benzoin? Why or
why not?
8.0 8.3 7.5 8.2 NMR nuclei observed: H Solvent: CDCl3 NMR field strength: 400MHz 7.0 6.5 6.0 5.5 5.0 4.5 4.0 3.5 3.0 2.5 (ppm) f1 8.1 8.0 7.9 7.8 7.7 7.6 7.5 7.4 7.3 f1 (ppm) 11 10 12 13 14 2.0 1.5...
47) The weights (in pounds) of a random sample of 32 new born babies, born at...
 47) The weights (in pounds) of a random sample of 32 new born babies, born at a particular 47) hospital are given below. Find the 95% confidence interval for the mean weight of the population of new born babies borm at this hospital. 7.5 6.4 7.1 7.1 6.8 8.6 74 6.4 74 7.0 6.0 7.8 9.0 7.3 6.5 5.8 8.4 7.6 7.2 6.5 8.5 7.1 6.3 6.9 7.0 5.9 8.3 6.6 73 77 6.4 8.2
The following data represent soil water content (percentage of water by volume) for independent random samples...
The following data represent soil water content (percentage of water by volume) for independent random samples of soil taken from two experimental fields growing bell peppers. Soil water content from field I: x1; n1 = 72 15.2 11.3 10.1 10.8 16.6 8.3 9.1 12.3 9.1 14.3 10.7 16.1 10.2 15.2 8.9 9.5 9.6 11.3 14.0 11.3 15.6 11.2 13.8 9.0 8.4 8.2 12.0 13.9 11.6 16.0 9.6 11.4 8.4 8.0 14.1 10.9 13.2 13.8 14.6 10.2 11.5 13.1 14.7 12.5...
Table 1: Time Clock Data from Security Detail (Supervisor is on salary) Employee Rate Monday Tuesday...
Table 1: Time Clock Data from Security Detail (Supervisor is on salary) Employee Rate Monday Tuesday Wednesday Thursday Friday Supervisor $25.00 8.0 8.0 8.0 8.0 8.0 Officer 1A $20.00 8.1 7.6 8.2 7.5 7.8 Officer 1B $20.00 7.4 7.3 7.8 7.1 8.1 Officer 2A $17.50 7.0 8.3 8.4 8.1 8.4 Officer 2B $17.50 8.2 7.3 7.7 7.7 8.4 Officer 2C $17.50 7.1 7.5 8.5 8.3 7.7 Officer 3A $15.00 7.2 7.8 8.3 7.8 7.6 Officer 3B $15.00 7.5 7.0 7.8...
 In West Texas, water is extremely important. The following data represent ph levels in ground water for a random sample of 102 West Texas wells. A pH less than 7 Is adidic and a pH above 7 is alkaline. Scanning the data, you can see that water in this region tends to be hard (alkaline). Too high a pH means the water is unusable or needs expensive treatment to make it usable.t These data are also available for download at...
 In West Texas, water is extremely important. The following data
represent pH levels in ground water for a random sample of 102 West
Texas wells. A pH less than 7 is acidic and a pH above 7 is
alkaline. Scanning the data, you can see that water in this region
tends to be hard (alkaline). Too high a pH means the water is
unusable or needs expensive treatment to make it usable.† These
data are also available for download at...
In West Texas, water is extremely important. The following data
represent pH levels in ground water for a random sample of 102 West
Texas wells. A pH less than 7 is acidic and a pH above 7 is
alkaline. Scanning the data, you can see that water in this region
tends to be hard (alkaline). Too high a pH means the water is
unusable or needs expensive treatment to make it usable.† These
data are also available for download at...
 4. A n experiment was set up to compare the effect of different soil pH and calcium additives on the increase in trunk diameters for orange trees. Annual applications of elemental sulfur, gypsum, soda ash, and other ingredients were applied to provide pH value levels of 4, 5, 6, and 7. Three levels of a calcium supplement (100, 200, and 300 pounds per acre) were also applied. All factor-level combinations of these two variables were used in the experiment. At...
 Customer Waiting Times (in minutes) 7.4 6.9 6.9 6.8 7.4 6.6 7.7 6.5 7.2 7.9 8.7 7.2 7.4 7.9 6.9 6.7 8.9 7.1 7.6 6.1 7.2 7.6 7.3 5.9 7.3 6.8 6.7 6.9 7.8 7.4 6.8 6.9 6.1 6.4 5.3 7.7 7.7 7.8 7.5 6.3 7.6 7.1 6.9 8.7 7.4 6.4 6.8 7.2 8.6 6.1 7.1 6.7 7.5 7.6 7.1 8.1 7.3 7.5 7.8 6.3 The accompanying data table includes weights (in grams) of a simple random sample of 40...
 In the proton NMR for benzil, there are clearly some impurity
peaks below 8 ppm. Although we cannot assign these for certain, is
it possible that these peaks come from unreacted benzoin? Why or
why not?
8.0 8.3 7.5 8.2 NMR nuclei observed: H Solvent: CDCl3 NMR field strength: 400MHz 7.0 6.5 6.0 5.5 5.0 4.5 4.0 3.5 3.0 2.5 (ppm) f1 8.1 8.0 7.9 7.8 7.7 7.6 7.5 7.4 7.3 f1 (ppm) 11 10 12 13 14 2.0 1.5...
In the proton NMR for benzil, there are clearly some impurity
peaks below 8 ppm. Although we cannot assign these for certain, is
it possible that these peaks come from unreacted benzoin? Why or
why not?
8.0 8.3 7.5 8.2 NMR nuclei observed: H Solvent: CDCl3 NMR field strength: 400MHz 7.0 6.5 6.0 5.5 5.0 4.5 4.0 3.5 3.0 2.5 (ppm) f1 8.1 8.0 7.9 7.8 7.7 7.6 7.5 7.4 7.3 f1 (ppm) 11 10 12 13 14 2.0 1.5...
 47) The weights (in pounds) of a random sample of 32 new born babies, born at a particular 47) hospital are given below. Find the 95% confidence interval for the mean weight of the population of new born babies borm at this hospital. 7.5 6.4 7.1 7.1 6.8 8.6 74 6.4 74 7.0 6.0 7.8 9.0 7.3 6.5 5.8 8.4 7.6 7.2 6.5 8.5 7.1 6.3 6.9 7.0 5.9 8.3 6.6 73 77 6.4 8.2
Most questions answered within 3 hours.
-
Consider the quantum number sets listed below.
What is the name of the smallest element for...
asked 5 minutes ago -
In python,write a function nameSet(first, last) that takes a
person's first and last names as input,...
asked 2 hours ago -
How do you think we should value management? Specifically how
might we try to determine MRPL...
asked 2 hours ago -
Suppose the Central Bank of Turkey starts to pay
interest on reserves. Under what circumstances this...
asked 2 hours ago -
For Bergson the concept of Being contains less reality than does
the concept of Becoming. True...
asked 3 hours ago -
What is the hydroxide ion concentration, [OH-], in a solution
with a hydronium ion concentration, [H3O+]...
asked 3 hours ago -
What species is the reducing agent in the following
equation?
Mg(s) + 2HCl (aq) --> MgCl2(aq)...
asked 3 hours ago -
A 50g ice cube is taken out of a freezer at 0 degrees Celsius
and put...
asked 5 hours ago -
How do ratios help you determine trends? What specific
information do managers look at? Is there...
asked 5 hours ago -
A wavelength of 514 nm is used to find an unknown diffraction
grating. If the separation...
asked 5 hours ago -
Use the central limit theorem to find the mean and standard
error of the mean of...
asked 5 hours ago -
You will be given a file that will contain averages for classes
which are divided into...
asked 5 hours ago