 Please explain steps and solve
thanks
Please explain steps and solve
thanks
State the conclusion in the problem context. significant predictor of the response There is no suggestive evidence at least one of the explanatory variables is a There is slightly suggestive evidence at least one of the explanatory variables is a significant predictor of the response. There is moderately suggestive evidence at least one of the explanatory variables is a significant predictor of the response There is convincing evidence at least one of the explanatory variables is a significant predictor of the response. (e) The estimated standard deviation of y when x1 = 17.3 and x2 = 48 is sy = 10.13. Use this to obtain the 95% CI for /uy 17.3, 48. (Round your answers to two decimal places.) (f) Use the information in parts (b) and (e) to obtain a 95% PI for yield in a future experiment when x1 = 17.3 and x2 = 48. (Round your answers to two decimal places.) (g) Given that x2 is in the model, would you retain X1? Yes, there is evidence this factor is significant. It should remain in the model. No, there isn't evidence this factor is significant. It should be dropped from the model You may use the f table at: http://www.stat.purdue.edu/~jtroisi/STAT350Spring2015/tables/FTable.pdf
Homework Answers
(a)
On running the given code, the summary output is,
> x1 =
c(16.7,17.4,18.4,16.8,18.9,17.1,17.3,18.2,21.3,21.2,20.7,18.5)
> x2 = c(30,42,47,47,43,41,48,44,43,50,56,60)
> y = c(210,110,103,103,91,76,73,70,68,53,45,31)
> mod = lm(y ~ x1 + x2)
> summary(mod)
Call:
lm(formula = y ~ x1 + x2)
Residuals:
Min 1Q Median 3Q Max
-41.730 -12.174 0.791 12.374 40.093
Coefficients:
Estimate Std. Error t value Pr(>|t|)
(Intercept) 415.113 82.517 5.031 0.000709 ***
x1 -6.593 4.859 -1.357 0.207913
x2 -4.504 1.071 -4.204 0.002292 **
---
Signif. codes: 0 ‘***’ 0.001 ‘**’ 0.01 ‘*’ 0.05 ‘.’ 0.1 ‘ ’
1
Residual standard error: 24.45 on 9 degrees of freedom
Multiple R-squared: 0.768, Adjusted R-squared:
0.7164
F-statistic: 14.9 on 2 and 9 DF, p-value: 0.001395
The estimated regression equation is,

(b)
Estimate of 
24.45
(c)
For x1 = 17.3, x2 = 48, the predicted y is,

y = 73
Residual = y - 
(d)
From the summary output,
f = 14.9
P-value = 0.0014
Since p-value is less than 0.05 significance level, we reject null hypothesis H0 and
There is convincing evidence that at least one of the explanatory variables is a significant predictor of the response.
(e)
The degree of freedom of residual standard error is 9
Critical t value for 95% confidence interval and df = 9 is 2.262
Margin of error = t * sd = 2.262 * 10.13 = 22.91406
Estimated 
95% CI is,
(84.8621 - 22.91406, 84.8621 + 22.91406)
(61.95, 107.78)
(f)
Residual standard error 
Margin of error for 95% PI = t * 


Estimated 
95% PI is,
(84.8621 - 57.56421, 84.8621 + 57.56421)
(27.30, 142.43)
*Note that, the answers can differ because of rounding issue.
(g)
Since, p-value for x1 (0.207913) is greater than 0.05 significance level, x1 is not significant in the model. Thus,
No, there isn't evidence this factor is significant. It should be dropped from the model.
Add Answer to:
Please explain steps and solve thanks The article "The Influence of Temperature and Sunshine on the Alpha-Acid Conte...
The article The Influence of Temperature and Sunshine on the Alpha-Acid Contents of Hops t reports the following data o...
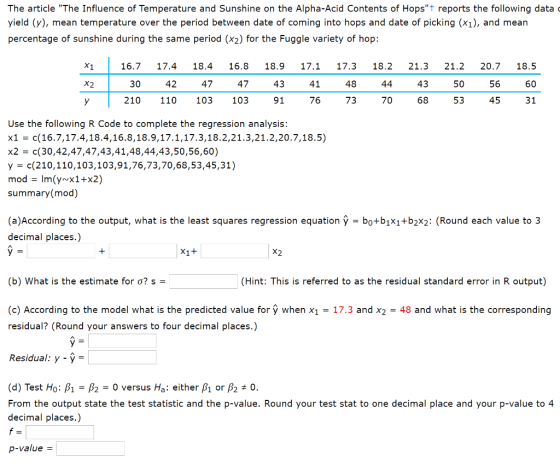
 The article The Influence of Temperature and Sunshine on the Alpha-Acid Contents of Hops t reports the following data on yield (y), mean temperature over the period between date of coming into hops and date of picking (x1), and mean percentage of sunshine during the same period (x2) for the Fuggle variety of hop 16.7 17.418.4 16.8 18.9 17.1 17.3 18.2 21.3 21.2 20.7 18.5 30 42 47 47 43 48 43 50 56 60 41 210 110 103 103...
The article "The Influence of Temperature and Sunshine on the Alpha-Acid Contents of Hops"t reports the followi...
 The article "The Influence of Temperature and Sunshine on the Alpha-Acid Contents of Hops"t reports the following data on yield (y), mean temperature over the period between date of coming into hops and date of picking (x1), and mean percentage of sunshine during the same period (x2) for the Fuggle variety of hop: X1 16.7 17.4 18.4 16.8 18.9 17.1 17.3 18.2 21.3 21.2 20.7 18.5 X2 48 30 42 47 47 43 41 44 43 50 56 60 76...
The ability of ecologists to identify regions of greatest species richness could have an impact on...
 The ability of ecologists to identify regions of greatest species richness could have an impact on the preservation of genetic diversity, a major objective of the World Conservation Strategy. A study used a sample of n = 31 lakes to obtain the estimated regression equation y 3.89 0.033x1 +0.024x2 0.023x3 0.0080x4 - 0.13x5 0.72x6 where y species richness, x1 = watershed area, x2 = shore width, x3 = poor drainage (%), x4 = water color (total color units), x5 sand...
Consider a binary response variable y and two explanatory variables x1 and x2. The following table...
Consider a binary response variable y and two explanatory variables x1 and x2. The following table contains the parameter estimates of the linear probability model (LPM) and the logit model, with the associated p-values shown in parentheses. Variable LPM Logit Constant −0.60 −2.50 0.02 (0.03 ) x1 0.28 0.99 (0.06 ) (0.06 ) x2 −0.06 −0.30 (0.03 ) (0.06 ) a. At the 5% significance level, comment on the significance of the variables for both models. Variable LPM Logit x1...
Consider a binary response variable y and two explanatory variables xy and x2. The following table contains the parameter estimates of the linear probability model (LPM) and the logit model, wit...
 Consider a binary response variable y and two explanatory variables xy and x2. The following table contains the parameter estimates of the linear probability model (LPM) and the logit model, with the associated p-values shown in parentheses. Constant .40 -2.30 x1 x2 0.06 (0.03) 0.36 0.90 (0.03)(0.07) -0.03-0.10 (0.02) (0.01) a. At the 5% significance level, comment on the significance of the variables for both models. Logit gnificant 0 (Not significant x1 x2 b. What is the predicted probability implied...
Use the Minitab output to answer the following questions. 1. What is the estimated value of...
 Use the Minitab output to answer the following questions. 1. What is the estimated value of B2? 2. What is the value of SST? 3. What is the value of MSR? 4. What is the value of S2? 5. What is the predicted value of Y when X1 = 7, X2 = 5, and X3 = 3? (round your answer to two decimal places) 6. What is the residual for the predicted value in question 5? The value of Y...
Use the following linear regression equation to answer the questions. x1 = 1.5 + 3.4x2 – 8.3x3 + 2.3x4 (a) Which variable is the response variable? Which variables are the explanatory variables? (b...
Use the following linear regression equation to answer the questions. x1 = 1.5 + 3.4x2 – 8.3x3 + 2.3x4 (a) Which variable is the response variable? Which variables are the explanatory variables? (b) Which number is the constant term? List the coefficients with their corresponding explanatory variables. constant? x2 coefficient? x3 coefficient? x4 coefficient? (c) If x2 = 1, x3 = 8, and x4 = 6, what is the predicted value for x1? (Use 1 decimal place.) (d) Explain how...
Please answer all parts, use question #2 to solve #3. 2. For a random sample of...
 Please answer all parts, use question #2 to solve #3.
2. For a random sample of size n = 25, the correlation is r = 0.31 for normal random variables X and Y. Answer the questions for the hypothesis test. Use a level of significance of a = 0.08. Ho: p= 0 H1: p0 a. The critical value is Z = b. The test statistic is Z = C. The p-value is d. The hypothesis (should, should not) be rejected....
Please answer all parts, use question #2 to solve #3.
2. For a random sample of size n = 25, the correlation is r = 0.31 for normal random variables X and Y. Answer the questions for the hypothesis test. Use a level of significance of a = 0.08. Ho: p= 0 H1: p0 a. The critical value is Z = b. The test statistic is Z = C. The p-value is d. The hypothesis (should, should not) be rejected....
Use the following linear regression equation to answer the questions. X1 = 1.7 + 3.6x2 -...
 Use the following linear regression equation to answer the questions. X1 = 1.7 + 3.6x2 - 8.4x3 + 1.5x4 (a) Which variable is the response variable? O X1 O X2 O X4 O X3 Which variables are the explanatory variables? (Select all that apply.) X3 X1 U X2 (b) Which number is the constant term? List the coefficients with their corresponding explanatory variables. constant X2 coefficient X3 coefficient X4 coefficient (c) If x2 = 8, X3 = 5, and x4...
Question 4 5 points Save Answer Researchers wondered whether the size of a person's brain was rel...
 answer that i can understand well please
Question 4 5 points Save Answer Researchers wondered whether the size of a person's brain was related to the individual's mental capacity They selected a sample of right-handed Anglo introdu psychology students who had Scholastic Aptitude Test scores higher than 1350. The subjects were administered the Wechsler Adult Intelligence Scale-Revised to obtain their IQ scores. The MRI scans, performed at the same facility, consisted of 18 horizontal MR images. The comp of the...
answer that i can understand well please
Question 4 5 points Save Answer Researchers wondered whether the size of a person's brain was related to the individual's mental capacity They selected a sample of right-handed Anglo introdu psychology students who had Scholastic Aptitude Test scores higher than 1350. The subjects were administered the Wechsler Adult Intelligence Scale-Revised to obtain their IQ scores. The MRI scans, performed at the same facility, consisted of 18 horizontal MR images. The comp of the...
 The article The Influence of Temperature and Sunshine on the Alpha-Acid Contents of Hops t reports the following data on yield (y), mean temperature over the period between date of coming into hops and date of picking (x1), and mean percentage of sunshine during the same period (x2) for the Fuggle variety of hop 16.7 17.418.4 16.8 18.9 17.1 17.3 18.2 21.3 21.2 20.7 18.5 30 42 47 47 43 48 43 50 56 60 41 210 110 103 103...
 The article "The Influence of Temperature and Sunshine on the Alpha-Acid Contents of Hops"t reports the following data on yield (y), mean temperature over the period between date of coming into hops and date of picking (x1), and mean percentage of sunshine during the same period (x2) for the Fuggle variety of hop: X1 16.7 17.4 18.4 16.8 18.9 17.1 17.3 18.2 21.3 21.2 20.7 18.5 X2 48 30 42 47 47 43 41 44 43 50 56 60 76...
 The ability of ecologists to identify regions of greatest species richness could have an impact on the preservation of genetic diversity, a major objective of the World Conservation Strategy. A study used a sample of n = 31 lakes to obtain the estimated regression equation y 3.89 0.033x1 +0.024x2 0.023x3 0.0080x4 - 0.13x5 0.72x6 where y species richness, x1 = watershed area, x2 = shore width, x3 = poor drainage (%), x4 = water color (total color units), x5 sand...
 Consider a binary response variable y and two explanatory variables xy and x2. The following table contains the parameter estimates of the linear probability model (LPM) and the logit model, with the associated p-values shown in parentheses. Constant .40 -2.30 x1 x2 0.06 (0.03) 0.36 0.90 (0.03)(0.07) -0.03-0.10 (0.02) (0.01) a. At the 5% significance level, comment on the significance of the variables for both models. Logit gnificant 0 (Not significant x1 x2 b. What is the predicted probability implied...
 Use the Minitab output to answer the following questions. 1. What is the estimated value of B2? 2. What is the value of SST? 3. What is the value of MSR? 4. What is the value of S2? 5. What is the predicted value of Y when X1 = 7, X2 = 5, and X3 = 3? (round your answer to two decimal places) 6. What is the residual for the predicted value in question 5? The value of Y...
 Please answer all parts, use question #2 to solve #3.
2. For a random sample of size n = 25, the correlation is r = 0.31 for normal random variables X and Y. Answer the questions for the hypothesis test. Use a level of significance of a = 0.08. Ho: p= 0 H1: p0 a. The critical value is Z = b. The test statistic is Z = C. The p-value is d. The hypothesis (should, should not) be rejected....
Please answer all parts, use question #2 to solve #3.
2. For a random sample of size n = 25, the correlation is r = 0.31 for normal random variables X and Y. Answer the questions for the hypothesis test. Use a level of significance of a = 0.08. Ho: p= 0 H1: p0 a. The critical value is Z = b. The test statistic is Z = C. The p-value is d. The hypothesis (should, should not) be rejected....
 Use the following linear regression equation to answer the questions. X1 = 1.7 + 3.6x2 - 8.4x3 + 1.5x4 (a) Which variable is the response variable? O X1 O X2 O X4 O X3 Which variables are the explanatory variables? (Select all that apply.) X3 X1 U X2 (b) Which number is the constant term? List the coefficients with their corresponding explanatory variables. constant X2 coefficient X3 coefficient X4 coefficient (c) If x2 = 8, X3 = 5, and x4...
 answer that i can understand well please
Question 4 5 points Save Answer Researchers wondered whether the size of a person's brain was related to the individual's mental capacity They selected a sample of right-handed Anglo introdu psychology students who had Scholastic Aptitude Test scores higher than 1350. The subjects were administered the Wechsler Adult Intelligence Scale-Revised to obtain their IQ scores. The MRI scans, performed at the same facility, consisted of 18 horizontal MR images. The comp of the...
answer that i can understand well please
Question 4 5 points Save Answer Researchers wondered whether the size of a person's brain was related to the individual's mental capacity They selected a sample of right-handed Anglo introdu psychology students who had Scholastic Aptitude Test scores higher than 1350. The subjects were administered the Wechsler Adult Intelligence Scale-Revised to obtain their IQ scores. The MRI scans, performed at the same facility, consisted of 18 horizontal MR images. The comp of the...
Most questions answered within 3 hours.
-
Humans have used horses for transportation for millions of
years. Therefore, they will use horses for...
asked 1 hour ago -
The following are the Jensen Corporation's unit costs of making
and selling an item at a...
asked 2 hours ago -
Does direct Medicare reimbursement of Advanced practice nurses
increase access to their services?
asked 3 hours ago -
List and explain why a company would choose to use a
published
compensation survey vs. creating...
asked 3 hours ago -
A discrete random variable X can take values from 1 to 10. Find
the variance of...
asked 3 hours ago -
The primary financial goal of a corporation is to maximize:
shareholders wealth.
earnings per share.
stock...
asked 3 hours ago -
determine whether the vectors u=(1,2,3,), v=(-2,1,0) and
w=(1,0,1) are linearly dependent or independent.
asked 3 hours ago -
python
Define a function called print_values which takes a dictionary
object as a parameter. The function...
asked 4 hours ago -
In Chapter 1 you created a program named Triangle in
which you displayed a seven-line triangle...
asked 4 hours ago -
Research question: What are the differences between separately
stated and non separately stated transactions in an...
asked 4 hours ago -
By using Arduino write a code that connects two LEDs to two
push-buttons. Each button controls...
asked 5 hours ago -
Bank of America has bonds that pay a coupon interest rate of 5.5
percent and mature...
asked 6 hours ago