
Homework Answers
lineweaver-burk equation is
=
+
now lineweaver-burk plot at no inhibitor
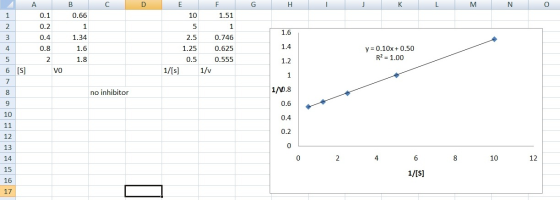
bestline equation is
y = 0.10 x + 0.50
so,
= 0.50
or, Vmax = (1/.0.50) = 2.00 nmol/min.
= 0.10
or, Km = Vmax
* 0.10 = (2 *0.10) = 0.20 M
now the plot in presence of inhibitor

best line equation is
y = 0.20 x + 0.5
or, Vmax = (1/.0.50 ) = 2.00 nmol/min.
= 0.20
or, Km = Vmax * 0.20 = (2 *0.20) =
0.40 M
Therefore, in presence of inhibitor Vmax is unchanged and Km has increased, so type of inhibition is competitive .
Competitive inhibitor : The structure of inhibitor is similar to substrate so it competes with the substrate so such kind of inhibition is overcome by increasing the substrate concentration.
Add Answer to:
and Vmax 2 points for interpreting the gapl Name (can be on graph paper or Excel. It is easier on Excel). This is w...
Name (Can be on graph paper or Excel. It is easier on Excel This is worth 10 points. 3 points for determining the c...
 Name (Can be on graph paper or Excel. It is easier on Excel This is worth 10 points. 3 points for determining the correct data, 3 points for the graph, 2 points each for the Km and Vmax (be sure to remember units 1. Use this experimental data to plot a lineweaver burke graph 2. Use the graph determine them and Vmax of the reaction 3. Be sure to keep the same number of sig figs in your answer, and...
please graph all 3 lines and explain the vmax&km How to: Lineweaver Burke 1. The following...
 please graph all 3 lines and explain the
vmax&km
How to: Lineweaver Burke 1. The following data was determined for an enzyme in the absence of an inhibitor and in the presence of two different inhibitors (V2 and V3). Determine the V. and K for the enzyme (1) Plot the data and determine the type of inhibition for each inhibitor (S) mm 1 V2 4.3 5.5 V1 12 20 29 2 relliate 150b
please graph all 3 lines and explain the
vmax&km
How to: Lineweaver Burke 1. The following data was determined for an enzyme in the absence of an inhibitor and in the presence of two different inhibitors (V2 and V3). Determine the V. and K for the enzyme (1) Plot the data and determine the type of inhibition for each inhibitor (S) mm 1 V2 4.3 5.5 V1 12 20 29 2 relliate 150b
4) (5 points) What fraction of Vmax is observed at [S] = 5 KM? 5) (20...
 4) (5 points) What fraction of Vmax is
observed at [S] = 5 KM?
5) (20 points) For the following data:
[S] (μM)
V0 (no inhibitor)
V0 (2.45 μM inhibitor present)
2.1
0.031
0.020
4.2
0.06
0.045
13
0.138
0.09
20
0.153
0.13
52
0.170
0.135
a) Construct a 1/v (y-axis) versus 1/[S]
(x-axis) plot in the space below.
b) Is the inhibition competitive, noncompetitive, or
uncompetitive?
c) Calculate KM, KMapp,
Vmax, and Vmaxapp....
4) (5 points) What fraction of Vmax is
observed at [S] = 5 KM?
5) (20 points) For the following data:
[S] (μM)
V0 (no inhibitor)
V0 (2.45 μM inhibitor present)
2.1
0.031
0.020
4.2
0.06
0.045
13
0.138
0.09
20
0.153
0.13
52
0.170
0.135
a) Construct a 1/v (y-axis) versus 1/[S]
(x-axis) plot in the space below.
b) Is the inhibition competitive, noncompetitive, or
uncompetitive?
c) Calculate KM, KMapp,
Vmax, and Vmaxapp....
CHEM3250 Assignment-Enzyme Inhibition Consider the data below for an enzyme catalyzed reaction. T...
 CHEM3250 Assignment-Enzyme Inhibition Consider the data below for an enzyme catalyzed reaction. The rate of the reaction has been determined with and without an inhibitor. A total concentration of enzyme of 20 uM was used in the experiment. SHOW WORK AND UNITS!!! Without Inhibitor With Inhibitor [substrate] (mM)Rate of formation of te of formation of product product (mM/min) mM/min) 6.67 5.25 0.49 7.04 38.91 1.0 2.2 6.9 41.8 44.0 1.5 3.5 1 a) On the same graph, plot the data...
9. The following data were obtained from an enzyme kinetics experiment. Graph the data using a...
 9. The following data were obtained from an enzyme kinetics experiment. Graph the data using a Lineweaver-Burk plot and determine the values for Km and Vmax. [S] (UM) V(nmol/min) 0.20 0.26 1.43 1.67 2.08 3.33 0.33 1.00
11. In Excel, prepare Lineweaver-Burk plots for the behavior of an enzyme for which the following...
 11. In Excel, prepare Lineweaver-Burk plots for the behavior of an enzyme for which the following experimental data are available: V, umol/min umol/min (No Inhibitor) S], mM (Inhibitor Present) 3.66 5.12 6.18 6.98 7.60 4.58 6.40 7.72 8.72 9.50 3.0 5.0 7.0 9.0 11.0 a. What are the KM and Vmax values for the inhibited and uninhibited reaction 5 pts. each reaction) b. Is the inhibitor competitive or noncompetitive? (5 pts.) Micheli-Menten) EQUATIONS: VV
Problem Set #3 Due in class 10/10/18 se in a classic 1. Sucrose (common table sugar)...
 Problem Set #3 Due in class 10/10/18 se in a classic 1. Sucrose (common table sugar) is hydrolyzed to glucose and fructo experiment in kinetics. The reaction is catalyzed by the enzyme invertase. Using the following data, determine by the Lineweaver-Burke method A) the Vmax and Km of the enzyme and B) whether the inhibition of this reaction by 2 M urea is competitive or noncompetitive. V, no inhibitor (arbitrary units) V, inhibitor present (same arbitrary units) Sucrose concentration 0.0292...
Prostaglandins are a class of eicosanoids (fatty acid derivatives) with a variety of extremely potent actions...
 Prostaglandins are a class of eicosanoids (fatty acid derivatives) with a variety of extremely potent actions on vertebrate tissues. They are responsible for producing fever and inflammation and its associated pain. Prostaglandins are derived from the 20-carbon fatty acid, arachidonic acid, in a reaction catalyzed by the enzyme, prostaglandin endoperoxide synthase. This uses oxygen to convert arachidonic acid to PGG2 (a prostaglandin). Ibuprofen inhibits this enzyme and is a fever reducer and anti-inflammatory agent. The kinetic data is given below...
What is the Km of this graph if 1/2 the Vmax with inhibitor- yellow dot- is...
 What is the Km of this graph if 1/2 the Vmax with inhibitor-
yellow dot- is 1.96. And Kmax 1/2 with out inhibitor(grey dot) is
2.34.
V/Inhibitor V/Reaction Rate (mol/min) V/No Inhinitor km(no inhibitor) Km/w/inhinitor) 0.00033 0.000033 0.000133 0.000133 0.00133 0.002 0.000667 [S] (mol/liters)
What is the Km of this graph if 1/2 the Vmax with inhibitor-
yellow dot- is 1.96. And Kmax 1/2 with out inhibitor(grey dot) is
2.34.
V/Inhibitor V/Reaction Rate (mol/min) V/No Inhinitor km(no inhibitor) Km/w/inhinitor) 0.00033 0.000033 0.000133 0.000133 0.00133 0.002 0.000667 [S] (mol/liters)
5) (14 marks) The following kinetic data were obtained for an enzyme in the absence of...
 5) (14 marks) The following kinetic data were obtained for an enzyme in the absence of inhibitor (1), and in the presence of an inhibitor at 5 mM concentration (2). Assume[ET] is the same in each experiment. [S] (MM) (1) v(umol/mL sec) 12 (2) v(umol/mL sec) 4.3 1 8 2 4 20 29 14 21 8 35 12 40 26 a. Using a graphing program (excel or sigmaplot) construct a lineweaver burke plot representing the uninhibited reaction and the inhibited...
 Name (Can be on graph paper or Excel. It is easier on Excel This is worth 10 points. 3 points for determining the correct data, 3 points for the graph, 2 points each for the Km and Vmax (be sure to remember units 1. Use this experimental data to plot a lineweaver burke graph 2. Use the graph determine them and Vmax of the reaction 3. Be sure to keep the same number of sig figs in your answer, and...
 please graph all 3 lines and explain the
vmax&km
How to: Lineweaver Burke 1. The following data was determined for an enzyme in the absence of an inhibitor and in the presence of two different inhibitors (V2 and V3). Determine the V. and K for the enzyme (1) Plot the data and determine the type of inhibition for each inhibitor (S) mm 1 V2 4.3 5.5 V1 12 20 29 2 relliate 150b
please graph all 3 lines and explain the
vmax&km
How to: Lineweaver Burke 1. The following data was determined for an enzyme in the absence of an inhibitor and in the presence of two different inhibitors (V2 and V3). Determine the V. and K for the enzyme (1) Plot the data and determine the type of inhibition for each inhibitor (S) mm 1 V2 4.3 5.5 V1 12 20 29 2 relliate 150b
 4) (5 points) What fraction of Vmax is
observed at [S] = 5 KM?
5) (20 points) For the following data:
[S] (μM)
V0 (no inhibitor)
V0 (2.45 μM inhibitor present)
2.1
0.031
0.020
4.2
0.06
0.045
13
0.138
0.09
20
0.153
0.13
52
0.170
0.135
a) Construct a 1/v (y-axis) versus 1/[S]
(x-axis) plot in the space below.
b) Is the inhibition competitive, noncompetitive, or
uncompetitive?
c) Calculate KM, KMapp,
Vmax, and Vmaxapp....
4) (5 points) What fraction of Vmax is
observed at [S] = 5 KM?
5) (20 points) For the following data:
[S] (μM)
V0 (no inhibitor)
V0 (2.45 μM inhibitor present)
2.1
0.031
0.020
4.2
0.06
0.045
13
0.138
0.09
20
0.153
0.13
52
0.170
0.135
a) Construct a 1/v (y-axis) versus 1/[S]
(x-axis) plot in the space below.
b) Is the inhibition competitive, noncompetitive, or
uncompetitive?
c) Calculate KM, KMapp,
Vmax, and Vmaxapp....
 CHEM3250 Assignment-Enzyme Inhibition Consider the data below for an enzyme catalyzed reaction. The rate of the reaction has been determined with and without an inhibitor. A total concentration of enzyme of 20 uM was used in the experiment. SHOW WORK AND UNITS!!! Without Inhibitor With Inhibitor [substrate] (mM)Rate of formation of te of formation of product product (mM/min) mM/min) 6.67 5.25 0.49 7.04 38.91 1.0 2.2 6.9 41.8 44.0 1.5 3.5 1 a) On the same graph, plot the data...
 9. The following data were obtained from an enzyme kinetics experiment. Graph the data using a Lineweaver-Burk plot and determine the values for Km and Vmax. [S] (UM) V(nmol/min) 0.20 0.26 1.43 1.67 2.08 3.33 0.33 1.00
 11. In Excel, prepare Lineweaver-Burk plots for the behavior of an enzyme for which the following experimental data are available: V, umol/min umol/min (No Inhibitor) S], mM (Inhibitor Present) 3.66 5.12 6.18 6.98 7.60 4.58 6.40 7.72 8.72 9.50 3.0 5.0 7.0 9.0 11.0 a. What are the KM and Vmax values for the inhibited and uninhibited reaction 5 pts. each reaction) b. Is the inhibitor competitive or noncompetitive? (5 pts.) Micheli-Menten) EQUATIONS: VV
 Problem Set #3 Due in class 10/10/18 se in a classic 1. Sucrose (common table sugar) is hydrolyzed to glucose and fructo experiment in kinetics. The reaction is catalyzed by the enzyme invertase. Using the following data, determine by the Lineweaver-Burke method A) the Vmax and Km of the enzyme and B) whether the inhibition of this reaction by 2 M urea is competitive or noncompetitive. V, no inhibitor (arbitrary units) V, inhibitor present (same arbitrary units) Sucrose concentration 0.0292...
 Prostaglandins are a class of eicosanoids (fatty acid derivatives) with a variety of extremely potent actions on vertebrate tissues. They are responsible for producing fever and inflammation and its associated pain. Prostaglandins are derived from the 20-carbon fatty acid, arachidonic acid, in a reaction catalyzed by the enzyme, prostaglandin endoperoxide synthase. This uses oxygen to convert arachidonic acid to PGG2 (a prostaglandin). Ibuprofen inhibits this enzyme and is a fever reducer and anti-inflammatory agent. The kinetic data is given below...
 What is the Km of this graph if 1/2 the Vmax with inhibitor-
yellow dot- is 1.96. And Kmax 1/2 with out inhibitor(grey dot) is
2.34.
V/Inhibitor V/Reaction Rate (mol/min) V/No Inhinitor km(no inhibitor) Km/w/inhinitor) 0.00033 0.000033 0.000133 0.000133 0.00133 0.002 0.000667 [S] (mol/liters)
What is the Km of this graph if 1/2 the Vmax with inhibitor-
yellow dot- is 1.96. And Kmax 1/2 with out inhibitor(grey dot) is
2.34.
V/Inhibitor V/Reaction Rate (mol/min) V/No Inhinitor km(no inhibitor) Km/w/inhinitor) 0.00033 0.000033 0.000133 0.000133 0.00133 0.002 0.000667 [S] (mol/liters)
 5) (14 marks) The following kinetic data were obtained for an enzyme in the absence of inhibitor (1), and in the presence of an inhibitor at 5 mM concentration (2). Assume[ET] is the same in each experiment. [S] (MM) (1) v(umol/mL sec) 12 (2) v(umol/mL sec) 4.3 1 8 2 4 20 29 14 21 8 35 12 40 26 a. Using a graphing program (excel or sigmaplot) construct a lineweaver burke plot representing the uninhibited reaction and the inhibited...
Most questions answered within 3 hours.
-
An MNE is this kind of industry when competition in one country
is essentially independent of...
asked 46 minutes ago -
. For this set of questions, determine what
proportion of a normal distribution is located betweeneach...
asked 1 hour ago -
A college student is employed as a door-to-door newspaper
salesman. Historical data suggests that the student...
asked 2 hours ago -
MATLAB HW 11 problem using Switch Case and Input commands
Write a script file that calculates...
asked 2 hours ago -
Considering gravitational time dilation, calculate the time that
passes in Earth’s surface while 1 hour passes...
asked 2 hours ago -
Minitab Problem: Take the Lake Hume June rainfall data and find
use the processes outlined in...
asked 3 hours ago -
X Company is trying to decide whether to continue using old
equipment to make Product A...
asked 3 hours ago -
IN PYTHON ONLY !! Program 2: Re-work
program #5 (WeeklyHours) from the previous assignment such that...
asked 4 hours ago -
The average length of time between arrivals at a turnpike
toll-booth is 26 seconds. What is...
asked 5 hours ago -
(a) A piston at 6.1 atm contains a gas that occupies a volume of
3.5 L....
asked 7 hours ago -
Please answer true or false. Words
cannot be changed or added in to make it true...
asked 7 hours ago -
An empty test tube weighs 15.923 grams. Then,
MgCl2•6H2O is added into the test tube. After...
asked 7 hours ago