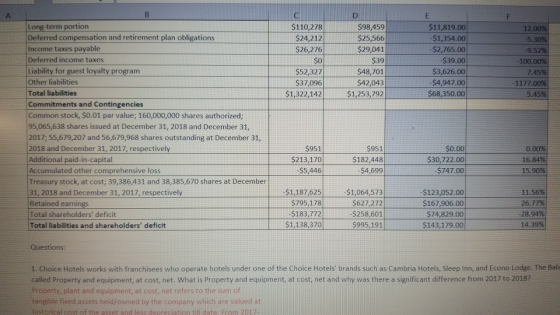
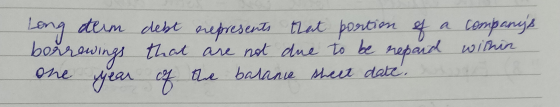
please read footnote 13 and answer Question #4


Homework Answers
Add Answer to:
please read footnote 13 and answer Question #4 Total shareholders's deficit 4. What does the "Long-term...
please answer question #5. the previous answer was incorrect. 5. What is the most significant trend...
 please answer question #5. the previous answer was
incorrect.
5. What is the most significant trend based on your horizontal analysis over this three-year period? Why? 12 Months Ended Horizontal Analysis Consolidated Balance Sheets - USD ($) $ in Thousands Dec. 31, 2018 Dec. 31, 2017 S Change 2017 to 2018 % Change 2017 to 2018 $208,694.00 -88.68% 1 Current assets Cash and cash equivalents $26,642 $235,336 Receivables (net of allowance for doubtful accounts of $15,905 and $12,221, respectively) $138,018...
please answer question #5. the previous answer was
incorrect.
5. What is the most significant trend based on your horizontal analysis over this three-year period? Why? 12 Months Ended Horizontal Analysis Consolidated Balance Sheets - USD ($) $ in Thousands Dec. 31, 2018 Dec. 31, 2017 S Change 2017 to 2018 % Change 2017 to 2018 $208,694.00 -88.68% 1 Current assets Cash and cash equivalents $26,642 $235,336 Receivables (net of allowance for doubtful accounts of $15,905 and $12,221, respectively) $138,018...
Please help with question #5 F A 12 Months Ended Horizontal Analysis Consolidated Balance Sheets- USD...
 Please help with question #5
F A 12 Months Ended Horizontal Analysis Consolidated Balance Sheets- USD ($) $ in Thousands $ Change 2017 to 2018 % Change 2017 to 2018 Dec. 31, 2017 Dec. 31, 2018 Current assets -88.68% -$208,694.00 $235,336 $26,642 Cash and cash equivalents Receivables (net of allowance for doubtful accounts of $15,905 and $12,221, respectively) $12,148.00 $10,122.00 9.65% $125,870 $0 $138,018 $10,122 $36,759 $32,243 0.00% Income taxes receivable 177.30% $23,503.00 $13,256 Notes receivable, net of allowances $6,276.00...
Please help with question #5
F A 12 Months Ended Horizontal Analysis Consolidated Balance Sheets- USD ($) $ in Thousands $ Change 2017 to 2018 % Change 2017 to 2018 Dec. 31, 2017 Dec. 31, 2018 Current assets -88.68% -$208,694.00 $235,336 $26,642 Cash and cash equivalents Receivables (net of allowance for doubtful accounts of $15,905 and $12,221, respectively) $12,148.00 $10,122.00 9.65% $125,870 $0 $138,018 $10,122 $36,759 $32,243 0.00% Income taxes receivable 177.30% $23,503.00 $13,256 Notes receivable, net of allowances $6,276.00...
please help with question 3. thanks for your help D 12 Months Ended 2 Horizontal Analysis...
 please help with question 3. thanks for your help
D 12 Months Ended 2 Horizontal Analysis Consolidated Balance Sheets - USD ($) $ in Thousands Dec. 31, 2018 Dec 31, 2017 S Change 2017 to 2018 % Change 2017 to 2018 0 5 Current assets 6 Cash and cash equivalents 7. Receivables (net of allowance for doubtful accounts of $15,905 and $12,221, respectively) 8 Income taxes receivable 9 Notes receivable, net of allowances 10 Other current assets 11 Total current...
please help with question 3. thanks for your help
D 12 Months Ended 2 Horizontal Analysis Consolidated Balance Sheets - USD ($) $ in Thousands Dec. 31, 2018 Dec 31, 2017 S Change 2017 to 2018 % Change 2017 to 2018 0 5 Current assets 6 Cash and cash equivalents 7. Receivables (net of allowance for doubtful accounts of $15,905 and $12,221, respectively) 8 Income taxes receivable 9 Notes receivable, net of allowances 10 Other current assets 11 Total current...
Consolidated Balance Sheets - USD ($) $ in Thousands Jun. 30, 2018 Dec. 31, 2017 Current...
Consolidated Balance Sheets - USD ($) $ in Thousands Jun. 30, 2018 Dec. 31, 2017 Current assets Cash and cash equivalents $ 37,148 $ 235,336 Receivables (net of allowance for doubtful accounts of $14,087 and $12,221, respectively) 186,034 125,870 Income taxes receivable 50 0 Notes receivable, net of allowance 29,237 13,256 Other current assets 30,683 25,967 Total current assets 283,152 400,429 Property and equipment, at cost, net 112,567 83,374 Goodwill 173,741 80,757 Intangible assets, net 248,469 100,492 Notes receivable, net...
please help with question 2 on the ratio analysis tab. I am attaching all tabs to...
 please help with question 2 on the ratio analysis tab.
I am attaching all tabs to help. thanks
A B C D E F G H I Instructions 1. Please enter the data from the previous tabs by clicking on the cell and typing and then clicking on the desired cell. For example to enter Net Income for 2018 type and go to the income statement tab and click on cell 127. 2. Complete the calculations. 3. Explain the significance...
please help with question 2 on the ratio analysis tab.
I am attaching all tabs to help. thanks
A B C D E F G H I Instructions 1. Please enter the data from the previous tabs by clicking on the cell and typing and then clicking on the desired cell. For example to enter Net Income for 2018 type and go to the income statement tab and click on cell 127. 2. Complete the calculations. 3. Explain the significance...
What is the long-term debt to equity ratio for the year ending 10/31/2011? (Note the current...
What is the long-term debt to equity ratio for the year ending 10/31/2011? (Note the current portion of long-term debts is short-term debt.) 0.601 0.727 0.844 0.938 1.213 Toro Co. (The) (NYS: TTC) Exchange rate used is that of the Year End reported date As Reported Annual Balance Sheet Report Date 10/31/2011 Currency USD Audit Status Not Qualified Consolidated Yes Scale Thousands Cash & cash equivalents 80,886 Customer receivables, gross 144,364 Less: allowance for doubtful accounts 1,964 Customers receivables, net...
Need help with what I got wrong, please. Following is the balance sheet for Target Corporation....
 Need help with what I got wrong, please.
Following is the balance sheet for Target Corporation. Prepare Target's common-size balance sheets as of February 3, 2018 and January 28, 2017. February 3, January 28, 2018 2017 $2,643 8,657 1,264 12,564 500 25,018 1,417 $2,512 3,309 1,169 11.990 24.658 1 783 $37.431 $38.999 ($ millions) Assets Cash and cash equivalents Inventory Other current assets Total current assets Property and equipment, net Oberon Other noncurrent assets Total assets liabilities Liabilities and shareholders'...
Need help with what I got wrong, please.
Following is the balance sheet for Target Corporation. Prepare Target's common-size balance sheets as of February 3, 2018 and January 28, 2017. February 3, January 28, 2018 2017 $2,643 8,657 1,264 12,564 500 25,018 1,417 $2,512 3,309 1,169 11.990 24.658 1 783 $37.431 $38.999 ($ millions) Assets Cash and cash equivalents Inventory Other current assets Total current assets Property and equipment, net Oberon Other noncurrent assets Total assets liabilities Liabilities and shareholders'...
1. What is the Long-Term Liabilities to Current Liabilities? 2. What is the Asset Turnover? 3....
 1. What is the Long-Term
Liabilities to Current Liabilities?
2. What is the Asset Turnover?
3. What are the Return on Assets?
4. Even though net earnings increased, net equity decreased
because:
a. Inventories shrank.
b. The company made major purchases of its corporate stock.
c. The company paid down its long-term debt.
d. income tax increased
THE HOME DEPOT, INC. CONSOLIDATED BALANCE SHEETS February 3, 2019 January 28, 2018 in millions, except per share data Assets Current assets: Cash...
1. What is the Long-Term
Liabilities to Current Liabilities?
2. What is the Asset Turnover?
3. What are the Return on Assets?
4. Even though net earnings increased, net equity decreased
because:
a. Inventories shrank.
b. The company made major purchases of its corporate stock.
c. The company paid down its long-term debt.
d. income tax increased
THE HOME DEPOT, INC. CONSOLIDATED BALANCE SHEETS February 3, 2019 January 28, 2018 in millions, except per share data Assets Current assets: Cash...
Please answer question number 4 using the information given Below are the financial statements of a...
 Please answer question number 4 using the information
given
Below are the financial statements of a public company for the last three years. Income statement Total Revenue Cost of Revenue Gross Profit Selling General and Administrative EBITDA Depreciation and Amortization Earnings Before Interest and Taxes Interest Expense Income Before Tax Income Tax Expense Net Income 2018 2017 2016 65,299,000 70,749,000 74,401,000 32,909,000 37,056,000 39.030,000 32,390,000 33,693,000 35,371,000 18,949,000 22,644,000 21,461,000 13,441,000 11,049,000 13,910,000 507,000 308,000 12,934,000 10,460,000 13,602,000 579,000 626,000...
Please answer question number 4 using the information
given
Below are the financial statements of a public company for the last three years. Income statement Total Revenue Cost of Revenue Gross Profit Selling General and Administrative EBITDA Depreciation and Amortization Earnings Before Interest and Taxes Interest Expense Income Before Tax Income Tax Expense Net Income 2018 2017 2016 65,299,000 70,749,000 74,401,000 32,909,000 37,056,000 39.030,000 32,390,000 33,693,000 35,371,000 18,949,000 22,644,000 21,461,000 13,441,000 11,049,000 13,910,000 507,000 308,000 12,934,000 10,460,000 13,602,000 579,000 626,000...
Directions: To answer the following questions, please reference the Etsy 2018 Annual Report 1. Convert the...
 Directions: To answer the following questions, please reference the Etsy 2018 Annual Report 1. Convert the Consolidated Statement of Operations (found in Item 8) into a common-size statement. (0.5 pts) 2. Looking at the Consolidated Statement of Operations, please answer the following: (1.5 pts) a. Has 2018 Gross Profit improved vs. 2017? If so, what could be some drivers that improved Gross Profit? Yes, it improved. b. In which year has Etsy improved its total operating expenses? In that year,...
 please answer question #5. the previous answer was
incorrect.
5. What is the most significant trend based on your horizontal analysis over this three-year period? Why? 12 Months Ended Horizontal Analysis Consolidated Balance Sheets - USD ($) $ in Thousands Dec. 31, 2018 Dec. 31, 2017 S Change 2017 to 2018 % Change 2017 to 2018 $208,694.00 -88.68% 1 Current assets Cash and cash equivalents $26,642 $235,336 Receivables (net of allowance for doubtful accounts of $15,905 and $12,221, respectively) $138,018...
please answer question #5. the previous answer was
incorrect.
5. What is the most significant trend based on your horizontal analysis over this three-year period? Why? 12 Months Ended Horizontal Analysis Consolidated Balance Sheets - USD ($) $ in Thousands Dec. 31, 2018 Dec. 31, 2017 S Change 2017 to 2018 % Change 2017 to 2018 $208,694.00 -88.68% 1 Current assets Cash and cash equivalents $26,642 $235,336 Receivables (net of allowance for doubtful accounts of $15,905 and $12,221, respectively) $138,018...
 Please help with question #5
F A 12 Months Ended Horizontal Analysis Consolidated Balance Sheets- USD ($) $ in Thousands $ Change 2017 to 2018 % Change 2017 to 2018 Dec. 31, 2017 Dec. 31, 2018 Current assets -88.68% -$208,694.00 $235,336 $26,642 Cash and cash equivalents Receivables (net of allowance for doubtful accounts of $15,905 and $12,221, respectively) $12,148.00 $10,122.00 9.65% $125,870 $0 $138,018 $10,122 $36,759 $32,243 0.00% Income taxes receivable 177.30% $23,503.00 $13,256 Notes receivable, net of allowances $6,276.00...
Please help with question #5
F A 12 Months Ended Horizontal Analysis Consolidated Balance Sheets- USD ($) $ in Thousands $ Change 2017 to 2018 % Change 2017 to 2018 Dec. 31, 2017 Dec. 31, 2018 Current assets -88.68% -$208,694.00 $235,336 $26,642 Cash and cash equivalents Receivables (net of allowance for doubtful accounts of $15,905 and $12,221, respectively) $12,148.00 $10,122.00 9.65% $125,870 $0 $138,018 $10,122 $36,759 $32,243 0.00% Income taxes receivable 177.30% $23,503.00 $13,256 Notes receivable, net of allowances $6,276.00...
 please help with question 3. thanks for your help
D 12 Months Ended 2 Horizontal Analysis Consolidated Balance Sheets - USD ($) $ in Thousands Dec. 31, 2018 Dec 31, 2017 S Change 2017 to 2018 % Change 2017 to 2018 0 5 Current assets 6 Cash and cash equivalents 7. Receivables (net of allowance for doubtful accounts of $15,905 and $12,221, respectively) 8 Income taxes receivable 9 Notes receivable, net of allowances 10 Other current assets 11 Total current...
please help with question 3. thanks for your help
D 12 Months Ended 2 Horizontal Analysis Consolidated Balance Sheets - USD ($) $ in Thousands Dec. 31, 2018 Dec 31, 2017 S Change 2017 to 2018 % Change 2017 to 2018 0 5 Current assets 6 Cash and cash equivalents 7. Receivables (net of allowance for doubtful accounts of $15,905 and $12,221, respectively) 8 Income taxes receivable 9 Notes receivable, net of allowances 10 Other current assets 11 Total current...
 please help with question 2 on the ratio analysis tab.
I am attaching all tabs to help. thanks
A B C D E F G H I Instructions 1. Please enter the data from the previous tabs by clicking on the cell and typing and then clicking on the desired cell. For example to enter Net Income for 2018 type and go to the income statement tab and click on cell 127. 2. Complete the calculations. 3. Explain the significance...
please help with question 2 on the ratio analysis tab.
I am attaching all tabs to help. thanks
A B C D E F G H I Instructions 1. Please enter the data from the previous tabs by clicking on the cell and typing and then clicking on the desired cell. For example to enter Net Income for 2018 type and go to the income statement tab and click on cell 127. 2. Complete the calculations. 3. Explain the significance...
 Need help with what I got wrong, please.
Following is the balance sheet for Target Corporation. Prepare Target's common-size balance sheets as of February 3, 2018 and January 28, 2017. February 3, January 28, 2018 2017 $2,643 8,657 1,264 12,564 500 25,018 1,417 $2,512 3,309 1,169 11.990 24.658 1 783 $37.431 $38.999 ($ millions) Assets Cash and cash equivalents Inventory Other current assets Total current assets Property and equipment, net Oberon Other noncurrent assets Total assets liabilities Liabilities and shareholders'...
Need help with what I got wrong, please.
Following is the balance sheet for Target Corporation. Prepare Target's common-size balance sheets as of February 3, 2018 and January 28, 2017. February 3, January 28, 2018 2017 $2,643 8,657 1,264 12,564 500 25,018 1,417 $2,512 3,309 1,169 11.990 24.658 1 783 $37.431 $38.999 ($ millions) Assets Cash and cash equivalents Inventory Other current assets Total current assets Property and equipment, net Oberon Other noncurrent assets Total assets liabilities Liabilities and shareholders'...
 1. What is the Long-Term
Liabilities to Current Liabilities?
2. What is the Asset Turnover?
3. What are the Return on Assets?
4. Even though net earnings increased, net equity decreased
because:
a. Inventories shrank.
b. The company made major purchases of its corporate stock.
c. The company paid down its long-term debt.
d. income tax increased
THE HOME DEPOT, INC. CONSOLIDATED BALANCE SHEETS February 3, 2019 January 28, 2018 in millions, except per share data Assets Current assets: Cash...
1. What is the Long-Term
Liabilities to Current Liabilities?
2. What is the Asset Turnover?
3. What are the Return on Assets?
4. Even though net earnings increased, net equity decreased
because:
a. Inventories shrank.
b. The company made major purchases of its corporate stock.
c. The company paid down its long-term debt.
d. income tax increased
THE HOME DEPOT, INC. CONSOLIDATED BALANCE SHEETS February 3, 2019 January 28, 2018 in millions, except per share data Assets Current assets: Cash...
 Please answer question number 4 using the information
given
Below are the financial statements of a public company for the last three years. Income statement Total Revenue Cost of Revenue Gross Profit Selling General and Administrative EBITDA Depreciation and Amortization Earnings Before Interest and Taxes Interest Expense Income Before Tax Income Tax Expense Net Income 2018 2017 2016 65,299,000 70,749,000 74,401,000 32,909,000 37,056,000 39.030,000 32,390,000 33,693,000 35,371,000 18,949,000 22,644,000 21,461,000 13,441,000 11,049,000 13,910,000 507,000 308,000 12,934,000 10,460,000 13,602,000 579,000 626,000...
Please answer question number 4 using the information
given
Below are the financial statements of a public company for the last three years. Income statement Total Revenue Cost of Revenue Gross Profit Selling General and Administrative EBITDA Depreciation and Amortization Earnings Before Interest and Taxes Interest Expense Income Before Tax Income Tax Expense Net Income 2018 2017 2016 65,299,000 70,749,000 74,401,000 32,909,000 37,056,000 39.030,000 32,390,000 33,693,000 35,371,000 18,949,000 22,644,000 21,461,000 13,441,000 11,049,000 13,910,000 507,000 308,000 12,934,000 10,460,000 13,602,000 579,000 626,000...
 Directions: To answer the following questions, please reference the Etsy 2018 Annual Report 1. Convert the Consolidated Statement of Operations (found in Item 8) into a common-size statement. (0.5 pts) 2. Looking at the Consolidated Statement of Operations, please answer the following: (1.5 pts) a. Has 2018 Gross Profit improved vs. 2017? If so, what could be some drivers that improved Gross Profit? Yes, it improved. b. In which year has Etsy improved its total operating expenses? In that year,...
Most questions answered within 3 hours.
-
5. The animals of which phylum use a water vascular system in
locomotion, feeding and gas...
asked 23 minutes ago -
*HOW DO I CHANGE THIS FROM A VOID FUNCTION TO A NON-VOID
WITH PARAMETERS?*
#include<iostream>
#include<fstream>...
asked 11 minutes ago -
I have a matrix, A= rand(2,3,2) ans(:,:,1) = 0.8116 0.3507
0.8759 0.5328 0.9390 0.5502 ans(:,:,2) =...
asked 15 minutes ago -
A commercial lubricant, Dubdeefordy, has K = SN/SM = 13.1 for
immiscible solvent M and N....
asked 16 minutes ago -
Examine several recent mergers and suggest the principal motives
for merging in each case. Discuss three...
asked 17 minutes ago -
If I want to make 50mL of 5M of NaCl, would I use: 14.6 grams of...
asked 23 minutes ago -
Find the expected value E(X), the variance Var(X) and the
standard deviation σ(X) for each of...
asked 32 minutes ago -
1.Mr. Bill S. Preston, Esq., purchased a new house for $90,000.
He paid $20,000 upfront and...
asked 33 minutes ago -
A resistor connected in parallel with an inductor draws 50mA
from the supply. Calculate the phase...
asked 32 minutes ago -
Typically, state taxable income includes:
a. Apportionable income only.
b. Nonapportionable income only.
c. Both "Apportionable...
asked 39 minutes ago -
A
certain population of children has height thus have a Normal
Distribution with a mean of...
asked 44 minutes ago -
For a class science experiment, the students had to grow beans
in a cup and see...
asked 49 minutes ago