
A is correct. Need help with B. I get the wrong answer when I follow the solution manual and all previous answers to this problem are incorrect.
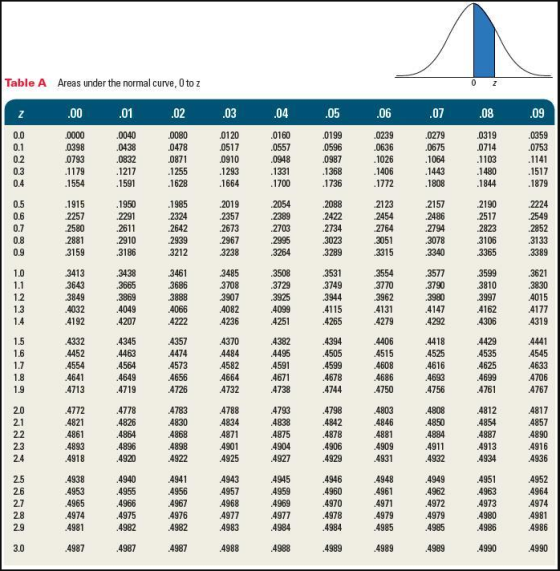
Table A Areas under the normal curve, 0 to z 00 01 .03 04 .05 .06 .07 .08 .09 Z 0000 0279 0.0 .0040 0080 0120 0160 0199 0239 0319 ,0359 0.1 0398 0438 0478 0517 0557 0596 0636 0675 0714 0753 0.2 0793 .0832 0871 0910 0948 0987 1026 1064 1103 1141 0.3 .1179 .1217 1255 1293 1331 1368 1406 1443 1480 .1517 0.4 .1554 .1591 .1628 .1664 .1700 1736 1772 1808 1844 1879 2224 0,5 1915 1950 1985 2019 2054 2088 .2123 .2157 2190 0.6 2257 2291 2324 2357 2389 2422 2454 2486 2517 2549 0.7 2580 2611 2642 2673 2703 2734 2764 2794 2823 2852 0,8 2881 2910 2939 2967 2995 3023 3051 3078 3106 3133 0.9 3159 3186 3212 3238 3264 3289 3315 3340 3365 3389 1.0 3413 3438 3461 3485 3508 3531 3554 3577 3599 3621 1.1 3643 3665 3686 3708 3729 3749 3770 3790 3810 3830 1.2 3849 3869 3888 3907 3925 3944 3962 3980 3997 4015 13 4032 4049 4066 4082 4099 4115 4131 4147 4162 4177 1.4 4192 4207 4222 4236 4251 4265 4279 4292 4306 4319 1.5 4332 4345 4357 4370 4382 4394 4406 4418 4429 4441 1.6 4452 4463 4474 4484 4495 4505 4515 4525 4535 4545 1.7 4554 4564 4573 4582 4591 4599 4608 4616 4625 4633 1.8 4641 4649 4656 4664 4671 4678 4686 4693 4699 4706 1.9 4713 4719 4726 4732 4738 4744 4750 4756 4761 4767 2.0 4772 4778 4783 4788 4793 4798 4803 4808 4812 4817 2.1 4821 4826 4830 4834 4838 4842 4846 4850 4854 4857 2.2 4861 4864 4868 4871 4875 4878 4881 4884 4887 4890 4898 4909 4916 2.3 4893 4896 4901 4904 4906 4911 4913 2,4 4918 4920 4922 4925 4927 4929 4931 4932 4934 4936 2,5 4938 4940 4941 4943 4945 4946 4948 4949 4951 4952 4957 4962 4963 4964 2.6 4953 4955 4956 4959 4960 4961 2.7 4965 4966 4967 4968 4969 4970 4971 4972 4973 4974 28 4974 4975 4976 4977 4977 4978 4979 4979 4980 4981 2.9 4981 4982 4982 4983 4984 4984 4985 4985 4986 4986 3.0 4987 4987 4987 4988 4988 4989 4989 4989 4990 4990 02
Homework Answers

Add Answer to:
A is correct. Need help with B. I get the wrong answer when I follow the solution manual and all previous answers to t...
Answer the Question please Typed - Written or Excel Pictures But not as hand writing pictures...
 Answer the Question please Typed - Written or Excel Pictures
But not as hand writing pictures
They need Z Values - Z Table
This is A Z-Values - Z-Table Example
4. Suppose the speed limits in 13 countries in miles per hour are as follows: Country Highway Miles per Hour Italy 87 France 81 Hungary 75 Belgium 75 Portugal 75 Great Britain Spain Denmark Netherlands Greece Japan Norway 56 Turkey 56 c) Calculate the expected value of the speed limit...
Answer the Question please Typed - Written or Excel Pictures
But not as hand writing pictures
They need Z Values - Z Table
This is A Z-Values - Z-Table Example
4. Suppose the speed limits in 13 countries in miles per hour are as follows: Country Highway Miles per Hour Italy 87 France 81 Hungary 75 Belgium 75 Portugal 75 Great Britain Spain Denmark Netherlands Greece Japan Norway 56 Turkey 56 c) Calculate the expected value of the speed limit...
A random sample of n= 100 observations is selected from a population with u = 29...
 A random sample of n= 100 observations is selected from a population with u = 29 and o = 21. Complete parts a through f. Click the icon to view the table of normal curve areas. a. Find 4; and on Hi = 29 0;= 2.1 (Round to one decimal place as needed.) b. Describe the shape of the sampling distribution of x. O A. Skewed right B. Approximately normal OC. Skewed left D. Uniform distribution c. Find PIX 228)...
please use the z table that i provided and show the workings The HR manager of...
 please use the z table that i provided and show the
workings
The HR manager of a large department store believes the number of resignations per week of casual staff at the store can be approximated by a normal distribution with a mean of 22 resignations per week and variance 61.3 (resignations per week). From a large amount of historical data available on the HR database regarding weekly resignations of casuals, a sample of 52 weeks was selected. What must...
please use the z table that i provided and show the
workings
The HR manager of a large department store believes the number of resignations per week of casual staff at the store can be approximated by a normal distribution with a mean of 22 resignations per week and variance 61.3 (resignations per week). From a large amount of historical data available on the HR database regarding weekly resignations of casuals, a sample of 52 weeks was selected. What must...
 Answer the Question please Typed - Written or Excel Pictures
But not as hand writing pictures
They need Z Values - Z Table
This is A Z-Values - Z-Table Example
4. Suppose the speed limits in 13 countries in miles per hour are as follows: Country Highway Miles per Hour Italy 87 France 81 Hungary 75 Belgium 75 Portugal 75 Great Britain Spain Denmark Netherlands Greece Japan Norway 56 Turkey 56 c) Calculate the expected value of the speed limit...
Answer the Question please Typed - Written or Excel Pictures
But not as hand writing pictures
They need Z Values - Z Table
This is A Z-Values - Z-Table Example
4. Suppose the speed limits in 13 countries in miles per hour are as follows: Country Highway Miles per Hour Italy 87 France 81 Hungary 75 Belgium 75 Portugal 75 Great Britain Spain Denmark Netherlands Greece Japan Norway 56 Turkey 56 c) Calculate the expected value of the speed limit...
 A random sample of n= 100 observations is selected from a population with u = 29 and o = 21. Complete parts a through f. Click the icon to view the table of normal curve areas. a. Find 4; and on Hi = 29 0;= 2.1 (Round to one decimal place as needed.) b. Describe the shape of the sampling distribution of x. O A. Skewed right B. Approximately normal OC. Skewed left D. Uniform distribution c. Find PIX 228)...
 please use the z table that i provided and show the
workings
The HR manager of a large department store believes the number of resignations per week of casual staff at the store can be approximated by a normal distribution with a mean of 22 resignations per week and variance 61.3 (resignations per week). From a large amount of historical data available on the HR database regarding weekly resignations of casuals, a sample of 52 weeks was selected. What must...
please use the z table that i provided and show the
workings
The HR manager of a large department store believes the number of resignations per week of casual staff at the store can be approximated by a normal distribution with a mean of 22 resignations per week and variance 61.3 (resignations per week). From a large amount of historical data available on the HR database regarding weekly resignations of casuals, a sample of 52 weeks was selected. What must...
Most questions answered within 3 hours.
-
What are some of the methods that creditors use to
reduce risk in credit transactions?
asked 50 seconds from now -
1 Explain HOW you would use the scientific method to test
which helps kids lose weight:...
asked 6 minutes ago -
1. Find the following z values for the standard normal
variable Z. (You may find it...
asked 3 minutes ago -
how immigrants foster innovations and how it lead to economic
growth of the host country????
"Not...
asked 5 minutes ago -
The normal-curve approximation can also be used for discrete
distribution other than the binomial distribution. For...
asked 7 minutes ago -
Given the complexities involved with supply chains, might it
make sense for a business to vertically...
asked 7 minutes ago -
MARKET EFFICIENCY IN-CLASS WORKSHEET 2 This question examines
the market for peanut butter. You will use...
asked 20 minutes ago -
An ideal gas (which is is a hypothetical gas that conforms to
the laws governing gas...
asked 23 minutes ago -
. If economic profits exist in perfect competition, in the long
run firms will enter because...
asked 27 minutes ago -
calculate the oxidation state of carbons C18H36O2 and
C18H36018
and then calculated the number of electrons...
asked 41 minutes ago -
Please respond to each of the below questions in a minimum of 5
well written paragraphs...
asked 35 minutes ago -
On January 1, Year 1, Brown Co. issued bonds with a face value
of $115,000, a...
asked 41 minutes ago