


5. Make a cluster bar chart to examine the correlation between gender and Daily hours of TV viewing variables. (Use the Daily hours of TV viewing variable as the category axis and gender variable as the cluster variable.) Frequency Male Female 2 hours or more Less than 2 hours Daily Hours of TV Viewing 6. Make a scatter plot to examine the correlation between Weight and Height variables, and write a sentence to describe the trend you observed from the scatter plot. Weight Height 7. Find the 5-number summary for the weight data in the table and make a boxplot for the Weight variable. Min.: QI: Median: Q3: Max.: Inter-quartile Range The distribution of the data is skewed to: (Circle the corect answer) A. left B t C. no skewness Make the boxplot in the following space.
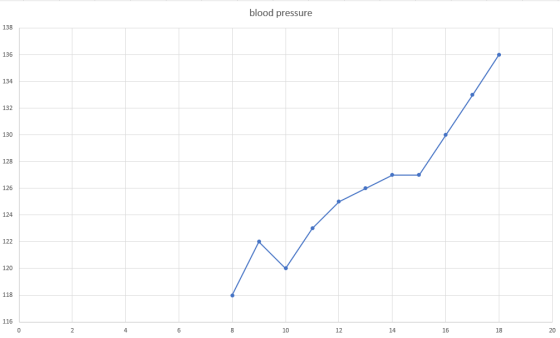
A nurse took the systolic blood pressure of a patient and recorded it every hour from 8 am to 6 pm. The data is shown in the following table. Produce a time plot to display the trend of the blood pressure measurements 8. Blood Pressure mm Hg 118 122 120 123 Time 8:00 9:00 10:00 11:00 12:00 13:00 125 126 14:00 15:00 127 127 130 133 136 16:00 17:00 18:00
Blood Pressure Time
Homework Answers
Q8)
data
| time | blood pressure |
| 8 | 118 |
| 9 | 122 |
| 10 | 120 |
| 11 | 123 |
| 12 | 125 |
| 13 | 126 |
| 14 | 127 |
| 15 | 127 |
| 16 | 130 |
| 17 | 133 |
| 18 | 136 |
Plot
Please copy paste the data for Q5-7
Add Answer to:
Organize and Display Data Data in the following data table were collected from a class of 9th grade students. ID...
8. Data were collected on the lengths of all phone calls made by college students on...
 8. Data were collected on the lengths of all phone calls made by college students on cell phones during one month. Two measures of center (mean and median) for this distribution were identified as 2.5 minutes and 13.7 minutes. Which of the following is true? The mean is 2.5 minutes and the median is 13.7 minutes because the distribution of the lengths is phone calls is most likely left-skewed. The mean is 2.5 minutes and the median is 13.7 minutes...
1 points Use the following data to answer the next three questions. A group of students...
 1 points Use the following data to answer the next three questions. A group of students are classified according to their gender and major. The results of this classification is presented in the following table Marketing Finance Accounting Cis Total Female 45 50 60 190 Male 60 70 50610 110 130 85400 1. If a student is selected at random, what is the probability that this student is male given that this student is majoring in Marketing 0.40 0.60 0.075...
The following table provides information on a sample of students in my class. Use the data...
 The following table provides information on a sample of students in my class. Use the data in the table to answers the questions that follow (show all calculations involved) and describe the typical student in my class. School Year Standing FRESHEMAN SOPHOMORE Major ECONOMICS MARKETING MANAGEMENTJUNIOR MARKETING Age(Years) 19.00 19.00 20.00 22.00 19.00 23.00 25.00 Attendance %) Name Albert, C. Allison, J. Amanda, B Anderson, M Ben, J Benedict, M Elizabeth, K Gender SAT Score 1,205 1,090 1,300 1,230 1,124...
Data was collected from a textile finishing process. Samples were collected daily and the number of...
Data was collected from a textile finishing process. Samples were collected daily and the number of nonconformities were recorded. (recall more than one nonconformity can be present on each unit) Day Number of units produced Number of Nonconformities 1 13 60 2 12 43 3 19 55 4 14 44 5 18 55 6 13 40 7 24 61 8 15 49 9 16 66 10 11 41 Using Minitab: 1. Construct an appropriate control chart for the above data....
A car rental agency has collected data on the demand for luxury-class automobiles over the past...
A car rental agency has collected data on the demand for luxury-class automobiles over the past 25 days. The data are shown below. Rental Demand Number of Days 7 2 8 5 9 8 10 7 11 3 Because customers drop cars at another location, the agency has 9 cars available currently. Question 1: What is the probability of 8 cars demand in a day? Select one: a. 0.1 b. 0.2 c. 0.3 d. 0.4 Question 2 What is the...
The following data were collected as part of a study of coffee consumption among medical students....
The following data were collected as part of a study of coffee consumption among medical students. The following reflect cups per day consumed: 3 4 6 8 2 1 0 2 First, put the data in order from lowest to highest: 0, 1, 2, 2, 3, 4, 6, 8 This will help you to find the median and the quartiles! 1) Compute the sample mean and round to one decimal place (see page 100). ____ 2) Compute the sample median...
The following data were collected as part of a study of coffee consumption among medical students....
 The following data were collected as part of a study of coffee consumption among medical students. The following reflect cups per day consumed: First, put the data in order from lowest to highest: 0, 1, 2, 2, 3, 4, 6, 8 This will help you to find the median and the quartiles 1) Compute the sample mean and round to one decimal place (see page 100), 2) Compute the sample median and round to one decimal place (see page 88)...
The following data were collected as part of a study of coffee consumption among medical students....
 The following data were collected as part of a study of coffee consumption among medical students. The following reflect cups per day consumed: First, put the data in order from lowest to highest: 0, 1, 2, 2, 3, 4, 6, 8 This will help you to find the median and the quartiles! 1) Compute the sample mean and round to ane decimal place (see page 100 2) Compute the sample median and round to one decimal place (see page 88)....
Question 5 (Use Data Set 1) Before every flight, the pilot must verify that the total weight of t...
 Question 5 (Use Data Set 1) Before every flight, the pilot must verify that the total weight of the load is less than the maximum allowable load for the aircraft. The Bombardier Dash 8 aircraft can carry 37 passengers, and a flight has fuel and baggage that allows for a total passenger load of 6200 lb. The pilot sees that the plane is full and all passengers are men. The aircraft will be overloaded if the mean weight of the...
2. The following data were collected last semester on ten students. Complete a multiple regression analysis in which you use AGE (A), MATH PROFICIENCY (MP) (on a 1 –10 scale), and GENDER (G) (0 = male...
2. The following data were collected last semester on ten students. Complete a multiple regression analysis in which you use AGE (A), MATH PROFICIENCY (MP) (on a 1 –10 scale), and GENDER (G) (0 = male, 1 = female) as predictors of FINAL EXAM (FE) performance. Do this analysis in SPSS and then answer the following questions. Subject # A MP G FE 1 35 8 1 90 2 31 6 0 88 3 26 5 1 84 4 33...
 8. Data were collected on the lengths of all phone calls made by college students on cell phones during one month. Two measures of center (mean and median) for this distribution were identified as 2.5 minutes and 13.7 minutes. Which of the following is true? The mean is 2.5 minutes and the median is 13.7 minutes because the distribution of the lengths is phone calls is most likely left-skewed. The mean is 2.5 minutes and the median is 13.7 minutes...
 1 points Use the following data to answer the next three questions. A group of students are classified according to their gender and major. The results of this classification is presented in the following table Marketing Finance Accounting Cis Total Female 45 50 60 190 Male 60 70 50610 110 130 85400 1. If a student is selected at random, what is the probability that this student is male given that this student is majoring in Marketing 0.40 0.60 0.075...
 The following table provides information on a sample of students in my class. Use the data in the table to answers the questions that follow (show all calculations involved) and describe the typical student in my class. School Year Standing FRESHEMAN SOPHOMORE Major ECONOMICS MARKETING MANAGEMENTJUNIOR MARKETING Age(Years) 19.00 19.00 20.00 22.00 19.00 23.00 25.00 Attendance %) Name Albert, C. Allison, J. Amanda, B Anderson, M Ben, J Benedict, M Elizabeth, K Gender SAT Score 1,205 1,090 1,300 1,230 1,124...
 The following data were collected as part of a study of coffee consumption among medical students. The following reflect cups per day consumed: First, put the data in order from lowest to highest: 0, 1, 2, 2, 3, 4, 6, 8 This will help you to find the median and the quartiles 1) Compute the sample mean and round to one decimal place (see page 100), 2) Compute the sample median and round to one decimal place (see page 88)...
 The following data were collected as part of a study of coffee consumption among medical students. The following reflect cups per day consumed: First, put the data in order from lowest to highest: 0, 1, 2, 2, 3, 4, 6, 8 This will help you to find the median and the quartiles! 1) Compute the sample mean and round to ane decimal place (see page 100 2) Compute the sample median and round to one decimal place (see page 88)....
 Question 5 (Use Data Set 1) Before every flight, the pilot must verify that the total weight of the load is less than the maximum allowable load for the aircraft. The Bombardier Dash 8 aircraft can carry 37 passengers, and a flight has fuel and baggage that allows for a total passenger load of 6200 lb. The pilot sees that the plane is full and all passengers are men. The aircraft will be overloaded if the mean weight of the...
Most questions answered within 3 hours.
-
A hedge fund is holding a three-year,
$10 million face value 6 percent annual coupon bond...
asked 1 minute ago -
The focal length of a makeup (concave) mirror is 0.48 m. What
magnification does this mirror...
asked 5 minutes ago -
TRUE/FALSE
Long-lived assets that are tangible in nature, used in the
operations of the business, and...
asked 6 minutes ago -
A dragon biologist is setting up an experimental population of
1000 individuals. In dragons, pointy crests...
asked 17 minutes ago -
A uniform thin rod of length 0.851 m is hung from a horizontal
nail passing through...
asked 26 minutes ago -
A 747 has a cruising speed of 235 m/s at a height of 10,700
meters. The...
asked 35 minutes ago -
Part 3: Arrows
Write a python program that prompts the user for a number of
columns,...
asked 42 minutes ago -
Need help answering these questions!!
1. What economic concept do you find most interesting in
Macroeconomics?...
asked 47 minutes ago -
1. Nimbus, Inc. produces and sells brooms. This table shows the
relationship between the number of...
asked 50 minutes ago -
A gas occupies 200. mL in a piston. If the pressure of the
piston were decreased...
asked 1 hour ago -
A fossil is found to have a 14C level of 71.0% compared to
living organisms. How...
asked 1 hour ago -
Many communist or socialist countries have a department that
addresses public health as well as the...
asked 1 hour ago