
Homework Answers
Add Answer to:
what is the correct answer choice? Question 9 1 pts In Spring 2017, data was collected from a random selection of S...
what is the correct answer choice? Question 8 1 pts In Spring 2017, data was collected...
 what is the correct answer choice?
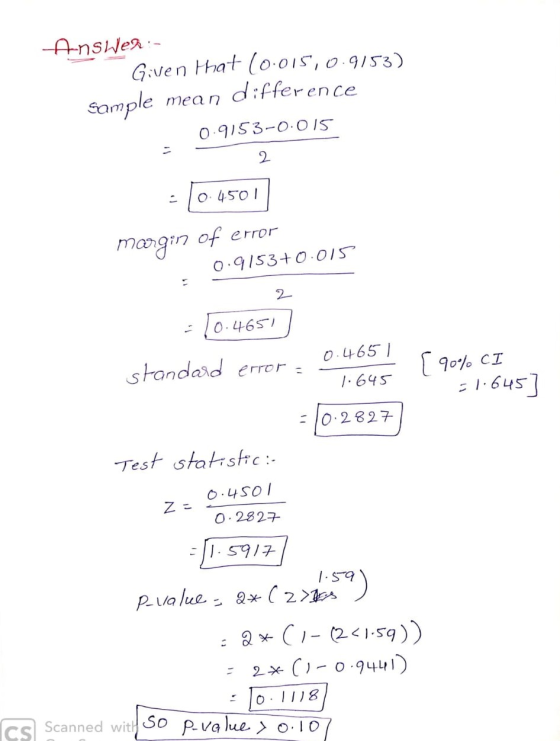
Question 8 1 pts In Spring 2017, data was collected from a random selection of STA 2023 students. One of the questions asked how much sleep they had gotten the previous night. The 95% confidence interval comparing underclassmen to upperclassmen was (-0.233, 1.1250) For the hypothesis Ho:mu 1-mu2 = 0 versus Ha:mu 1-mu2 does not equal O, what would be the p-value? e p-value = 0.05 p-value < 0.05 p-value > 0.05 Can not...
what is the correct answer choice?
Question 8 1 pts In Spring 2017, data was collected from a random selection of STA 2023 students. One of the questions asked how much sleep they had gotten the previous night. The 95% confidence interval comparing underclassmen to upperclassmen was (-0.233, 1.1250) For the hypothesis Ho:mu 1-mu2 = 0 versus Ha:mu 1-mu2 does not equal O, what would be the p-value? e p-value = 0.05 p-value < 0.05 p-value > 0.05 Can not...
what are the correct fill ins Question 6 1 pts In Spring 2017, data was collected from a random selection of STA 20...
 what are the correct fill ins
Question 6 1 pts In Spring 2017, data was collected from a random selection of STA 2023 students. One of the questions asked how many hours they had worked the previous day. The 95% confidence interval comparing underclassmen to upperclassmen was (-0.233, 1.1250) Interpret the interval. (Select] "We are 95% confident that the hours of sleep for underclassmen is between 0.233 [Select] to 1.1250 [Select ] that upperclassmen."
what are the correct fill ins
Question 6 1 pts In Spring 2017, data was collected from a random selection of STA 2023 students. One of the questions asked how many hours they had worked the previous day. The 95% confidence interval comparing underclassmen to upperclassmen was (-0.233, 1.1250) Interpret the interval. (Select] "We are 95% confident that the hours of sleep for underclassmen is between 0.233 [Select] to 1.1250 [Select ] that upperclassmen."
what are the correct fill ins? Question 7 1 pts In Spring 2017, data was collected from a random selection of STA 2...
 what are the correct fill ins?
Question 7 1 pts In Spring 2017, data was collected from a random selection of STA 2023 students. One of the questions asked how many football games did you attend in Fall 2016. The 95% confidence interval comparing underclassmen to upperclassmen was (-1.10, 1.8512) Interpret the interval. "We are 95% confident that the [Select] number of football games attended for underclassmen is between 1.10 (Select) to 1.85 [Select] that upperclassmen." Question 8 1 pts
what are the correct fill ins?
Question 7 1 pts In Spring 2017, data was collected from a random selection of STA 2023 students. One of the questions asked how many football games did you attend in Fall 2016. The 95% confidence interval comparing underclassmen to upperclassmen was (-1.10, 1.8512) Interpret the interval. "We are 95% confident that the [Select] number of football games attended for underclassmen is between 1.10 (Select) to 1.85 [Select] that upperclassmen." Question 8 1 pts
what is the correct answer choice? Question 2 1 pts In Spring 2017, data was collected...
 what is the correct answer choice?
Question 2 1 pts In Spring 2017, data was collected from a random selection of STA 2023 students. One of the questions asked how many hours they had worked in the past 24 hours. For the 39 randomly selected upperclassmen, the sample mean was 0.61 and sample standard deviation was 2.32. For the 35 randomly selected underclassmen, the sample mean was 1.40 and the sample standard deviation was 2.65. What is the point estimate...
what is the correct answer choice?
Question 2 1 pts In Spring 2017, data was collected from a random selection of STA 2023 students. One of the questions asked how many hours they had worked in the past 24 hours. For the 39 randomly selected upperclassmen, the sample mean was 0.61 and sample standard deviation was 2.32. For the 35 randomly selected underclassmen, the sample mean was 1.40 and the sample standard deviation was 2.65. What is the point estimate...
what is the fill ins? 379314/quizzes/736248/take Question 7 1 pts In Spring 2017, data was collected...
 what is the fill ins?
379314/quizzes/736248/take Question 7 1 pts In Spring 2017, data was collected from a random selection of STA 2023 students. One of the questions asked how many football games did you attend in Fall 2016. The 95% confidence interval comparing underclassmen to upperclassmen was (-1.10, 1.8512) Interpret the interval. "We are 95% confident that the population proportion number of football games attended for underclassmen is between 1.10 (Select] to 1.85 [Select) that upperclassmen." Question 8 1...
what is the fill ins?
379314/quizzes/736248/take Question 7 1 pts In Spring 2017, data was collected from a random selection of STA 2023 students. One of the questions asked how many football games did you attend in Fall 2016. The 95% confidence interval comparing underclassmen to upperclassmen was (-1.10, 1.8512) Interpret the interval. "We are 95% confident that the population proportion number of football games attended for underclassmen is between 1.10 (Select] to 1.85 [Select) that upperclassmen." Question 8 1...
Two random samples of student loans were collected: one from students at for-profit schools and another...
 Two random samples of student loans were collected: one from students at for-profit schools and another from students at non-profit schools. The accompanying data show the sample sizes and the number of loans in each sample that defaulted. Complete parts a through c. Click the icon to view the loan data. a. Perform a hypothesis test using a = 0.10 to determine if the proportion of for-profit loans that default is larger than the proportion of loans for nonprofit schools...
Please answer all 3 questions 8. 7. Question 9 1 pts Assume that the data has...
 Please answer all 3 questions
8.
7.
Question 9 1 pts Assume that the data has a normal distribution and the number of observations is greater than fifty. Find the critical z value used to test a null hypothesis. a=0.05 for a test of the hypothesis that the mean is greater than or equal to 98. 0 -2.326 0 -1.960 0 -1.645 O +1.645 O 1.960 Find the appropriate critical value (either Za/2 or ta/2) Confidence level = 99% and...
Please answer all 3 questions
8.
7.
Question 9 1 pts Assume that the data has a normal distribution and the number of observations is greater than fifty. Find the critical z value used to test a null hypothesis. a=0.05 for a test of the hypothesis that the mean is greater than or equal to 98. 0 -2.326 0 -1.960 0 -1.645 O +1.645 O 1.960 Find the appropriate critical value (either Za/2 or ta/2) Confidence level = 99% and...
Please answer all Question 24 1 pts Solve the problem. A 90% confidence interval for the...
 Please answer all
Question 24 1 pts Solve the problem. A 90% confidence interval for the average salary of all CEOs in the electronics industry was constructed using the results of a random survey of 45 CEOs. The interval was to make more useful inferences from the data, it is desired to reduce the width of the confidence interval. Which of the following will result in a reduced interval width? O Decrease the sample size and decrease the confidence level....
Please answer all
Question 24 1 pts Solve the problem. A 90% confidence interval for the average salary of all CEOs in the electronics industry was constructed using the results of a random survey of 45 CEOs. The interval was to make more useful inferences from the data, it is desired to reduce the width of the confidence interval. Which of the following will result in a reduced interval width? O Decrease the sample size and decrease the confidence level....
10:15 GX 1.51%. e s o s IL Multiple choice (60 p cholesben 1. The shape...
 10:15 GX 1.51%. e s o s IL Multiple choice (60 p cholesben 1. The shape of the Men deviation 2. The standard Standard deviat i le devii d curve la tribal the value i n 15 3. Ir the were mad e is 2.5 or distribution is 45 and standard deviation of normal distributors is that the value of x for a distribution is 97.5 47.5 e 373 4 675 See other value. 4. Considering the normal distribution, pal...
 what is the correct answer choice?
Question 8 1 pts In Spring 2017, data was collected from a random selection of STA 2023 students. One of the questions asked how much sleep they had gotten the previous night. The 95% confidence interval comparing underclassmen to upperclassmen was (-0.233, 1.1250) For the hypothesis Ho:mu 1-mu2 = 0 versus Ha:mu 1-mu2 does not equal O, what would be the p-value? e p-value = 0.05 p-value < 0.05 p-value > 0.05 Can not...
what is the correct answer choice?
Question 8 1 pts In Spring 2017, data was collected from a random selection of STA 2023 students. One of the questions asked how much sleep they had gotten the previous night. The 95% confidence interval comparing underclassmen to upperclassmen was (-0.233, 1.1250) For the hypothesis Ho:mu 1-mu2 = 0 versus Ha:mu 1-mu2 does not equal O, what would be the p-value? e p-value = 0.05 p-value < 0.05 p-value > 0.05 Can not...
 what are the correct fill ins
Question 6 1 pts In Spring 2017, data was collected from a random selection of STA 2023 students. One of the questions asked how many hours they had worked the previous day. The 95% confidence interval comparing underclassmen to upperclassmen was (-0.233, 1.1250) Interpret the interval. (Select] "We are 95% confident that the hours of sleep for underclassmen is between 0.233 [Select] to 1.1250 [Select ] that upperclassmen."
what are the correct fill ins
Question 6 1 pts In Spring 2017, data was collected from a random selection of STA 2023 students. One of the questions asked how many hours they had worked the previous day. The 95% confidence interval comparing underclassmen to upperclassmen was (-0.233, 1.1250) Interpret the interval. (Select] "We are 95% confident that the hours of sleep for underclassmen is between 0.233 [Select] to 1.1250 [Select ] that upperclassmen."
 what are the correct fill ins?
Question 7 1 pts In Spring 2017, data was collected from a random selection of STA 2023 students. One of the questions asked how many football games did you attend in Fall 2016. The 95% confidence interval comparing underclassmen to upperclassmen was (-1.10, 1.8512) Interpret the interval. "We are 95% confident that the [Select] number of football games attended for underclassmen is between 1.10 (Select) to 1.85 [Select] that upperclassmen." Question 8 1 pts
what are the correct fill ins?
Question 7 1 pts In Spring 2017, data was collected from a random selection of STA 2023 students. One of the questions asked how many football games did you attend in Fall 2016. The 95% confidence interval comparing underclassmen to upperclassmen was (-1.10, 1.8512) Interpret the interval. "We are 95% confident that the [Select] number of football games attended for underclassmen is between 1.10 (Select) to 1.85 [Select] that upperclassmen." Question 8 1 pts
 what is the correct answer choice?
Question 2 1 pts In Spring 2017, data was collected from a random selection of STA 2023 students. One of the questions asked how many hours they had worked in the past 24 hours. For the 39 randomly selected upperclassmen, the sample mean was 0.61 and sample standard deviation was 2.32. For the 35 randomly selected underclassmen, the sample mean was 1.40 and the sample standard deviation was 2.65. What is the point estimate...
what is the correct answer choice?
Question 2 1 pts In Spring 2017, data was collected from a random selection of STA 2023 students. One of the questions asked how many hours they had worked in the past 24 hours. For the 39 randomly selected upperclassmen, the sample mean was 0.61 and sample standard deviation was 2.32. For the 35 randomly selected underclassmen, the sample mean was 1.40 and the sample standard deviation was 2.65. What is the point estimate...
 what is the fill ins?
379314/quizzes/736248/take Question 7 1 pts In Spring 2017, data was collected from a random selection of STA 2023 students. One of the questions asked how many football games did you attend in Fall 2016. The 95% confidence interval comparing underclassmen to upperclassmen was (-1.10, 1.8512) Interpret the interval. "We are 95% confident that the population proportion number of football games attended for underclassmen is between 1.10 (Select] to 1.85 [Select) that upperclassmen." Question 8 1...
what is the fill ins?
379314/quizzes/736248/take Question 7 1 pts In Spring 2017, data was collected from a random selection of STA 2023 students. One of the questions asked how many football games did you attend in Fall 2016. The 95% confidence interval comparing underclassmen to upperclassmen was (-1.10, 1.8512) Interpret the interval. "We are 95% confident that the population proportion number of football games attended for underclassmen is between 1.10 (Select] to 1.85 [Select) that upperclassmen." Question 8 1...
 Two random samples of student loans were collected: one from students at for-profit schools and another from students at non-profit schools. The accompanying data show the sample sizes and the number of loans in each sample that defaulted. Complete parts a through c. Click the icon to view the loan data. a. Perform a hypothesis test using a = 0.10 to determine if the proportion of for-profit loans that default is larger than the proportion of loans for nonprofit schools...
 Two random samples of student loans were collected: one from students at for-profit schools and another from students at non-profit schools. The accompanying data show the sample sizes and the number of loans in each sample that defaulted. Complete parts a through c. Click the icon to view the loan data. a. Perform a hypothesis test using a = 0.10 to determine if the proportion of for-profit loans that default is larger than the proportion of loans for nonprofit schools...
 Please answer all 3 questions
8.
7.
Question 9 1 pts Assume that the data has a normal distribution and the number of observations is greater than fifty. Find the critical z value used to test a null hypothesis. a=0.05 for a test of the hypothesis that the mean is greater than or equal to 98. 0 -2.326 0 -1.960 0 -1.645 O +1.645 O 1.960 Find the appropriate critical value (either Za/2 or ta/2) Confidence level = 99% and...
Please answer all 3 questions
8.
7.
Question 9 1 pts Assume that the data has a normal distribution and the number of observations is greater than fifty. Find the critical z value used to test a null hypothesis. a=0.05 for a test of the hypothesis that the mean is greater than or equal to 98. 0 -2.326 0 -1.960 0 -1.645 O +1.645 O 1.960 Find the appropriate critical value (either Za/2 or ta/2) Confidence level = 99% and...
 Please answer all
Question 24 1 pts Solve the problem. A 90% confidence interval for the average salary of all CEOs in the electronics industry was constructed using the results of a random survey of 45 CEOs. The interval was to make more useful inferences from the data, it is desired to reduce the width of the confidence interval. Which of the following will result in a reduced interval width? O Decrease the sample size and decrease the confidence level....
Please answer all
Question 24 1 pts Solve the problem. A 90% confidence interval for the average salary of all CEOs in the electronics industry was constructed using the results of a random survey of 45 CEOs. The interval was to make more useful inferences from the data, it is desired to reduce the width of the confidence interval. Which of the following will result in a reduced interval width? O Decrease the sample size and decrease the confidence level....
 10:15 GX 1.51%. e s o s IL Multiple choice (60 p cholesben 1. The shape of the Men deviation 2. The standard Standard deviat i le devii d curve la tribal the value i n 15 3. Ir the were mad e is 2.5 or distribution is 45 and standard deviation of normal distributors is that the value of x for a distribution is 97.5 47.5 e 373 4 675 See other value. 4. Considering the normal distribution, pal...
Most questions answered within 3 hours.
-
Minitab Problem: Take the Lake Hume June rainfall data and find
use the processes outlined in...
asked 48 minutes ago -
X Company is trying to decide whether to continue using old
equipment to make Product A...
asked 49 minutes ago -
IN PYTHON ONLY !! Program 2: Re-work
program #5 (WeeklyHours) from the previous assignment such that...
asked 1 hour ago -
The average length of time between arrivals at a turnpike
toll-booth is 26 seconds. What is...
asked 3 hours ago -
(a) A piston at 6.1 atm contains a gas that occupies a volume of
3.5 L....
asked 4 hours ago -
Please answer true or false. Words
cannot be changed or added in to make it true...
asked 4 hours ago -
An empty test tube weighs 15.923 grams. Then,
MgCl2•6H2O is added into the test tube. After...
asked 4 hours ago -
Assume memory access is 10 units of time and disk access is
10000 units of time....
asked 4 hours ago -
1. Are all good samples random?
2. Magazines often report surveys giving statistics such as “63%...
asked 4 hours ago -
Under all the various types of market structures, firms
must eventually earn some economic profits for...
asked 4 hours ago -
Consider the following fitness regime for a single locus trait
with two co-dominant alleles: w11 =...
asked 4 hours ago -
A large cable company reports the following.
80% of its customers subscribe to its cable TV...
asked 5 hours ago