


Homework Answers
Add Answer to:
Two random samples of student loans were collected: one from students at for-profit schools and another...
Two random samples of student loans were collected: one from students at for-profit schools and another...
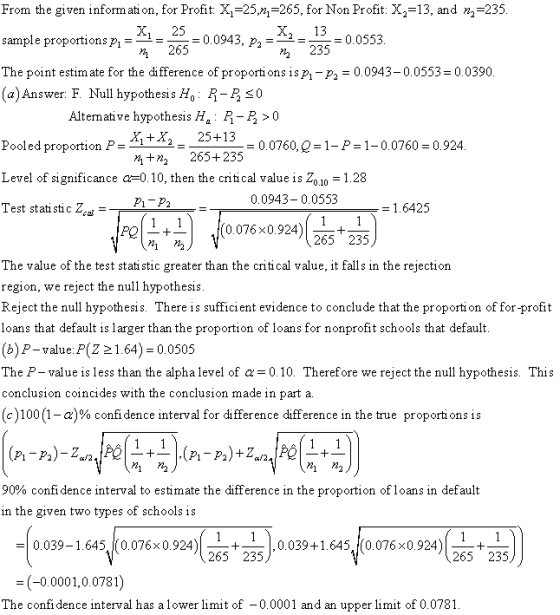
 Two random samples of student loans were collected: one from students at for-profit schools and another from students at non-profit schools. The accompanying data show the sample sizes and the number of loans in each sample that defaulted. Complete parts a through c. Click the icon to view the loan data. a. Perform a hypothesis test using a = 0.10 to determine if the proportion of for-profit loans that default is larger than the proportion of loans for nonprofit schools...
Independent random samples were selected from two binomial populations, with sample sizes and the number of...
 Independent random samples were selected from two binomial populations, with sample sizes and the number of successes given below. Population 1 2 500 500 119 148 Sample Size Number of Successes State the null and alternative hypotheses to test for a difference in the two population proportions. O Ho: (P1-P2) # O versus H: (P1-P2) = 0 O Ho: (P1-P2) = 0 versus Hy: (P1-P2) > 0 HO: (P1-P2) < 0 versus Ha: (P1-P2) > 0 HO: (P1-P2) = 0...
Two different simple random samples are drawn from two different populations. The first sample consists of...
 Two different simple random samples are drawn from two different populations. The first sample consists of 40 people with 20 having a common attribute. The second sam ple consists of 2200 people with 1570 of them having the same common attribute. Compare the results from a hypothesis test of p1 = p2 (with a 0.05 significance level) and a 95% confidence interval estimate of p1-p2 What are the null and alternative hypotheses for the hypothesis test? A. Ho : p1...
A simple random sample of front seat occupants involved in car crashes is obtained. Among 2920...
 A simple random sample of front seat occupants involved in car crashes is obtained. Among 2920 occupants not wearing seat belts, 37 were killed. Among 7709 occupants wearing seat belts, 15 were killed. Use a 0.05 significance level to test the claim that seat belts are effective in reducing fatalities. Complete parts (a) through (c) below. a. Test the claim using a hypothesis test. Consider the first sample to be the sample of occupants not wearing seat belts and the...
Independent random samples of students were taken from two high schools, R and S, and the...
Independent random samples of students were taken from two high schools, R and S, and the proportion of students who drive to school in each sample was recorded. The difference between the two sample proportions (R minus S) was 0.07. Under the assumption that all conditions for inference were met, a hypothesis test was conducted where the alternative hypothesis was the population proportion of students who drive to school for R was greater than that for S. The p-value of...
1. Independent random samples of students were taken from two high schools, R and S, and...
1. Independent random samples of students were taken from two high schools, R and S, and the proportion of students who drive to school in each sample was recorded. The difference between the two sample proportions (R minus S) was 0.07. Under the assumption that all conditions for inference were met, a hypothesis test was conducted where the alternative hypothesis was the population proportion of students who drive to school for R was greater than that for S. The p-value...
The numbers of successes and the sample sizes for independent simple random samples from two populations...
 The numbers of successes and the sample sizes for independent simple random samples from two populations are provided for a two-tailed test and a 95% confidence interval. Complete parts (a) through (d). Xy = 21, n = 60, X2 = 22, n2 = 100, a = 0.05 Click here to view a table of areas under the standard normal curve for negative values of Click here to view a table of areas under the standard normal curve for RoSive values...
Given two independent random samples with the following results: Given two independent random samples with the...
 Given two independent random samples with the following
results:
Given two independent random samples with the following results: ni = 586 n2 = 404 x = 161 X2 = 68 Can it be concluded that there is a difference between the two population proportions? Use a significance level of a= 0.05 for the test. Copy Data Step 1 of 6: State the null and alternative hypotheses for the test. Answer 2 Points Keypad Ho: P1 HAPI P2 - P2 Step...
Given two independent random samples with the following
results:
Given two independent random samples with the following results: ni = 586 n2 = 404 x = 161 X2 = 68 Can it be concluded that there is a difference between the two population proportions? Use a significance level of a= 0.05 for the test. Copy Data Step 1 of 6: State the null and alternative hypotheses for the test. Answer 2 Points Keypad Ho: P1 HAPI P2 - P2 Step...
A simple random sample of front-seat occupants involved in car crashes is obtained. Among 2736 occupants...
 A simple random sample of front-seat occupants involved in car crashes is obtained. Among 2736 occupants not wearing seat belts, 39 were killed. Among 7798 occupants wearing seat belts, 19 were killed. Use a 0.05 significance level to test the claim that seat belts are effective in reducing fatalities. Complete parts (a) through (C) below. a. Test the claim using a hypothesis test. Consider the first sample to be the sample of occupants not wearing seat belts and the second...
Question 19 4 pts A random sample of 100 students at a high school was asked...
 Question 19 4 pts A random sample of 100 students at a high school was asked whether they would ask their father or mother for help with a financial problem. A second sample of 100 different students was asked the same question regarding a dating problem. If 43 students in the first sample and 47 students in the second sample replied that they turned to their mother rather than their father for help, test the hypothesis of no difference in...
 Two random samples of student loans were collected: one from students at for-profit schools and another from students at non-profit schools. The accompanying data show the sample sizes and the number of loans in each sample that defaulted. Complete parts a through c. Click the icon to view the loan data. a. Perform a hypothesis test using a = 0.10 to determine if the proportion of for-profit loans that default is larger than the proportion of loans for nonprofit schools...
 Independent random samples were selected from two binomial populations, with sample sizes and the number of successes given below. Population 1 2 500 500 119 148 Sample Size Number of Successes State the null and alternative hypotheses to test for a difference in the two population proportions. O Ho: (P1-P2) # O versus H: (P1-P2) = 0 O Ho: (P1-P2) = 0 versus Hy: (P1-P2) > 0 HO: (P1-P2) < 0 versus Ha: (P1-P2) > 0 HO: (P1-P2) = 0...
 Two different simple random samples are drawn from two different populations. The first sample consists of 40 people with 20 having a common attribute. The second sam ple consists of 2200 people with 1570 of them having the same common attribute. Compare the results from a hypothesis test of p1 = p2 (with a 0.05 significance level) and a 95% confidence interval estimate of p1-p2 What are the null and alternative hypotheses for the hypothesis test? A. Ho : p1...
 A simple random sample of front seat occupants involved in car crashes is obtained. Among 2920 occupants not wearing seat belts, 37 were killed. Among 7709 occupants wearing seat belts, 15 were killed. Use a 0.05 significance level to test the claim that seat belts are effective in reducing fatalities. Complete parts (a) through (c) below. a. Test the claim using a hypothesis test. Consider the first sample to be the sample of occupants not wearing seat belts and the...
 The numbers of successes and the sample sizes for independent simple random samples from two populations are provided for a two-tailed test and a 95% confidence interval. Complete parts (a) through (d). Xy = 21, n = 60, X2 = 22, n2 = 100, a = 0.05 Click here to view a table of areas under the standard normal curve for negative values of Click here to view a table of areas under the standard normal curve for RoSive values...
 Given two independent random samples with the following
results:
Given two independent random samples with the following results: ni = 586 n2 = 404 x = 161 X2 = 68 Can it be concluded that there is a difference between the two population proportions? Use a significance level of a= 0.05 for the test. Copy Data Step 1 of 6: State the null and alternative hypotheses for the test. Answer 2 Points Keypad Ho: P1 HAPI P2 - P2 Step...
Given two independent random samples with the following
results:
Given two independent random samples with the following results: ni = 586 n2 = 404 x = 161 X2 = 68 Can it be concluded that there is a difference between the two population proportions? Use a significance level of a= 0.05 for the test. Copy Data Step 1 of 6: State the null and alternative hypotheses for the test. Answer 2 Points Keypad Ho: P1 HAPI P2 - P2 Step...
 A simple random sample of front-seat occupants involved in car crashes is obtained. Among 2736 occupants not wearing seat belts, 39 were killed. Among 7798 occupants wearing seat belts, 19 were killed. Use a 0.05 significance level to test the claim that seat belts are effective in reducing fatalities. Complete parts (a) through (C) below. a. Test the claim using a hypothesis test. Consider the first sample to be the sample of occupants not wearing seat belts and the second...
 Question 19 4 pts A random sample of 100 students at a high school was asked whether they would ask their father or mother for help with a financial problem. A second sample of 100 different students was asked the same question regarding a dating problem. If 43 students in the first sample and 47 students in the second sample replied that they turned to their mother rather than their father for help, test the hypothesis of no difference in...
Most questions answered within 3 hours.
-
39.4% of US homes continue to use a landline in addition to cell
phone service. 3...
asked 19 minutes ago -
Starting with benzene, synthesize 1-phenyl-1-butyne.
Show intermediates and reagents.
asked 1 hour ago -
Create a 32-run crossed array design with six control factors
and two noise factors such that...
asked 2 hours ago -
A 500g sample of sand from source A has the following amounts
retained on each sieve....
asked 2 hours ago -
In
your own words, please explain the essay by John Keynes wrote "The
End of Laissez...
asked 2 hours ago -
How are the matrix and pixels related? Why are smaller
pixels better for diagnostic quality?
asked 2 hours ago -
2. An AC generator has 80 rectangular loops on
its armature. Each loop is 11 cm...
asked 2 hours ago -
Please help me with this question. Consider Aldi’s current and
potential geographic markets (see Exhibit 4...
asked 2 hours ago -
What are the main components of the fermentation process and
give an explanation of each? Include...
asked 2 hours ago -
Explain which types of cells in the body (belonging to which
organs, etc.) are sensitive to...
asked 2 hours ago -
A single cable supports an 703-kg elevator car. What is the
tension in the cable when...
asked 2 hours ago -
among the three different ways to link CSS specifications to an
HTML document (inline CSS, document...
asked 2 hours ago