
Homework Answers
Answer:
c)
x1=21, n1=60, x2=22, n2=100,  =0.05
=0.05


Ho: P1 = P2
Ha: P1  P2
P2
formula for test statistics is

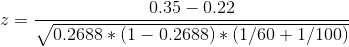
z = 1.796
z= 1.80
Test statistics (z) = 1.80
calculate p-value
P-Value = 2 * (1- P(z < 1.80))
calculate P(z < 1.80) using normal z table
P(z < 1.80) = 0.9641
P-Value = 2 * (1- 0.9641)
P-Value = 0.0718
since (P-Value=0.0718) > (
=0.05)
Failed to reject null hypothesis.
Add Answer to:
The numbers of successes and the sample sizes for independent simple random samples from two populations...
The number of successes and the sample size for a simple random sample from a population...
 The number of successes and the sample size for a simple random sample from a population are given below. X-7, 6-35. H:p=0.4, H:p<0.42-001 a. Determine the sample proportion b. Decide whether using the one-proportion z test is appropriate c. If appropriate, use the one-proportion z test to perform the specified hypothesis test. Click here to view a table of areas under the standard normal curve for negative values of z. c. Determine the test statistic, if appropriate Select the correct...
Independent random samples were selected from two binomial populations, with sample sizes and the number of...
 Independent random samples were selected from two binomial populations, with sample sizes and the number of successes given below. Population 1 2 500 500 119 148 Sample Size Number of Successes State the null and alternative hypotheses to test for a difference in the two population proportions. O Ho: (P1-P2) # O versus H: (P1-P2) = 0 O Ho: (P1-P2) = 0 versus Hy: (P1-P2) > 0 HO: (P1-P2) < 0 versus Ha: (P1-P2) > 0 HO: (P1-P2) = 0...
The numbers of successes and the sample sizes for independent simple random samples from two popu...
The numbers of successes and the sample sizes for independent simple random samples from two populations are x 1equals32, n 1equals40, x 2equals10, n 2equals20. a. Use the two-proportions plus-four z-interval procedure to find an 95% confidence interval for the difference between the two populations proportions. b. Compare your result with the result of a two-proportion z-interval procedure, if finding such a confidence interval is appropriate.
The numbers of successes and the sample sizes are given for independent simple random samples from...
The numbers of successes and the sample sizes are given for independent simple random samples from two populations. Use the two-proportions z-test to conduct the required hypothesis test. Use the critical-value approach. x1 = 24, n1 = 60, x2 = 12, n2 = 40, two-tailed test, α = 0.05
The numbers of successes and the sample sizes are given for independent simple random samples from...
The numbers of successes and the sample sizes are given for independent simple random samples from two populations. Use the two-proportions z-test to conduct the required hypothesis test. Use the critical-value approach. x1 = 24, n1 = 60, x2 = 28, n2 = 40, left-tailed test, α = 0.05
the sample size for a simple random sample from a population are given below x=8,n.32. Ho:...
 the sample size for a simple random sample from a population are given below x=8,n.32. Ho: p-o4. Ha : p<0.4, α:010 a. Determine the sample proportion. b. Decide whether using the one-proportion z-test is appropriate. c. If appropriate, use the one-proportion z-test to perform the speified hypothesis test. Click here to view a table of areas under the standard normal curve for negative values of z a. The sample proportion is (Type an integer or a decimal. Do not round.)...
Assume that we have selected two independent random samples from populations having proportions pl and P2...
 Assume that we have selected two independent random samples from populations having proportions pl and P2 and that picture 1-80011000 = 0.8 and a picture 2-950/1000-0.95. Test Ho·P:-P22-12 versus H P1 P2く-12 by using a-value and by setting α equal to 10, 05, 01, and .001. How much evidence is there that P2 exceeds pl by more than 127 Round p-value to 4 decimal and z value to 2 decimal places. Negative amount should be indicated by a minus sign.)...
A random sample of n = 137 individuals results in X1 = 45 successes. An independent...
 A random sample of n = 137 individuals results in X1 = 45 successes. An independent sample of n2 = 151 individuals results in X2 = 58 successes. Does this represent sufficient evidence to conclude that p; <P2 at the x = 0.01 level of significance? Click here to view the standard normal distribution table (page 1). Click here to view the standard normal distribution table (page 2). Click here to view the table of critical t-values. Click here to...
Assume that the two samples are independent simple random samples selected from normally distributed populations. Do...
 Assume that the two samples are independent simple random samples selected from normally distributed populations. Do not assume that the population standard deviations are equal Refer to the accompanying data set. Use a 0.05 significance level to test the claim that women and me Click the icon to view the data for diastolic blood pressure for men and women Data for Diastolic Blood Pressure of Men and Women Let , be the mean diastolic blood pressure for women and let...
17. A random sample of n, 133 individuals results in xy +39 successes. An independent sample...
 17. A random sample of n, 133 individuals results in xy +39 successes. An independent sample of ny - 147 individuals results in X - 58 successes. Does this represent sufficient evidence to conclude that P1 P2 at the a=0.01 level of significance? Click here to view the standard normal distribution table (page 1). Click here to view the standard normal distribution table (page 2). Click here to view the table of critical t-values. Click here to view the chi-square...
 The number of successes and the sample size for a simple random sample from a population are given below. X-7, 6-35. H:p=0.4, H:p<0.42-001 a. Determine the sample proportion b. Decide whether using the one-proportion z test is appropriate c. If appropriate, use the one-proportion z test to perform the specified hypothesis test. Click here to view a table of areas under the standard normal curve for negative values of z. c. Determine the test statistic, if appropriate Select the correct...
 Independent random samples were selected from two binomial populations, with sample sizes and the number of successes given below. Population 1 2 500 500 119 148 Sample Size Number of Successes State the null and alternative hypotheses to test for a difference in the two population proportions. O Ho: (P1-P2) # O versus H: (P1-P2) = 0 O Ho: (P1-P2) = 0 versus Hy: (P1-P2) > 0 HO: (P1-P2) < 0 versus Ha: (P1-P2) > 0 HO: (P1-P2) = 0...
 the sample size for a simple random sample from a population are given below x=8,n.32. Ho: p-o4. Ha : p<0.4, α:010 a. Determine the sample proportion. b. Decide whether using the one-proportion z-test is appropriate. c. If appropriate, use the one-proportion z-test to perform the speified hypothesis test. Click here to view a table of areas under the standard normal curve for negative values of z a. The sample proportion is (Type an integer or a decimal. Do not round.)...
 Assume that we have selected two independent random samples from populations having proportions pl and P2 and that picture 1-80011000 = 0.8 and a picture 2-950/1000-0.95. Test Ho·P:-P22-12 versus H P1 P2く-12 by using a-value and by setting α equal to 10, 05, 01, and .001. How much evidence is there that P2 exceeds pl by more than 127 Round p-value to 4 decimal and z value to 2 decimal places. Negative amount should be indicated by a minus sign.)...
 A random sample of n = 137 individuals results in X1 = 45 successes. An independent sample of n2 = 151 individuals results in X2 = 58 successes. Does this represent sufficient evidence to conclude that p; <P2 at the x = 0.01 level of significance? Click here to view the standard normal distribution table (page 1). Click here to view the standard normal distribution table (page 2). Click here to view the table of critical t-values. Click here to...
 Assume that the two samples are independent simple random samples selected from normally distributed populations. Do not assume that the population standard deviations are equal Refer to the accompanying data set. Use a 0.05 significance level to test the claim that women and me Click the icon to view the data for diastolic blood pressure for men and women Data for Diastolic Blood Pressure of Men and Women Let , be the mean diastolic blood pressure for women and let...
 17. A random sample of n, 133 individuals results in xy +39 successes. An independent sample of ny - 147 individuals results in X - 58 successes. Does this represent sufficient evidence to conclude that P1 P2 at the a=0.01 level of significance? Click here to view the standard normal distribution table (page 1). Click here to view the standard normal distribution table (page 2). Click here to view the table of critical t-values. Click here to view the chi-square...
Most questions answered within 3 hours.
-
What mechanisms Drive speciation??
(I.e. what was Dawins theory on the orgin of species, and how...
asked 8 minutes ago -
The manager at a car assembly plant believes that the mean
assembly time for a car...
asked 1 hour ago -
Which of the following is true of electron capture?
A) It decreases the nuclide's mass number...
asked 2 hours ago -
Assuming an efficiency of 43.10%, calculate the actual yield of
magnesium nitrate formed from 114.9 g...
asked 3 hours ago -
The highly pathogenic bacterium Clostridium
perfringens causes gangrene, a disease that results in the
destruction of...
asked 4 hours ago -
In the context of situation analysis, which of the following is
a category for analysis in...
asked 4 hours ago -
In a study of the gas phase decomposition of sulfuryl chloride
at 600 K SO2Cl2(g)SO2(g) +...
asked 4 hours ago -
75 g of 2-propanol (C3H8O) and 25 g of pentane are mixed in a
200 mL...
asked 4 hours ago -
The 2800-turn coil in a dc motor has an area per turn of 1.1 ×
10-2...
asked 5 hours ago -
Draw a combinational logic circuit diagram with a symbol inside
the box for two I/P of...
asked 5 hours ago -
The cliché we use quite a lot in finance is: there is a need to
maximize...
asked 5 hours ago -
In class we discussed the addition of HCl to alpha pinene. Would
you expect one or...
asked 5 hours ago