![then due to sampling variation (6) If the average fuel economy is [Select] [Select ] of all possible sample mean fuel economi](http://img.homeworklib.com/images/cd4cde6f-d146-4dd3-9225-f9aeecf67bd1.png?x-oss-process=image/resize,w_560)
then due to sampling variation (6) If the average fuel economy is [Select] [Select ] of all possible sample mean fuel economies are expected to be alone [Select ] when the sample consist of 79 cars each. This [Select ] suggest that the average fuel economy of all Japanese cars [Select If we are making an error here, what type of error would it be? [Select ]
Homework Answers
Solution:-
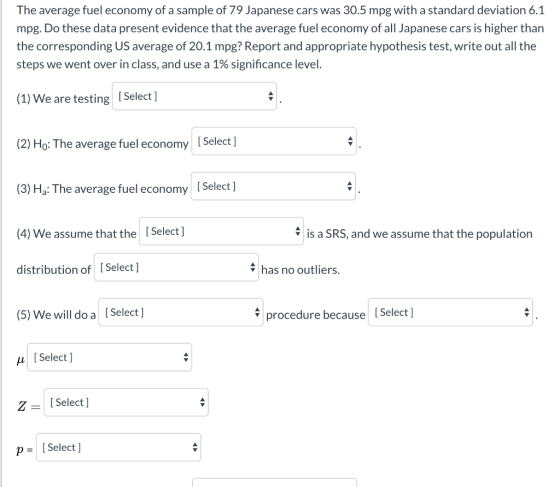
1) We are testing population mean.
2) H0 : The average fuel economy of all Japanese car is 20.1 mpg.
3) HA : The average fuel economy of all Japanese car is greater than 20.1 mpg
4) We assume that the sample is SRS and we assume that the population distribution of Japanese cars has no outliers.
5)
We will do a one-sample z-test procedure, because the sample size is large enough.


z = 15.15
p-value is less than 0.0001.
6) If the average fuel economy is 20.1, then due to the sampling error alone 0.00 of all possible sample mean fuel economies are expected to be equal to or greater than 30.5 mpg, when the sample consists of 79 cars each.
This strongly suggests that the average economy of all the Japanese cars is greater than 30.5.
If we are making an error here, we might have committed type I error.
Add Answer to:
The average fuel economy of a sample of 79 Japanese cars was 30.5 mpg with a standard deviation 6.1 mpg. Do these data...
8. In a recent year the fuel economy of all passenger vehicles was 19.8 mpg. A...
 8. In a recent year the fuel economy of all passenger vehicles was 19.8 mpg. A trade organization sampled 50 passenger vehicles for fuel economy and obtained a sample mean of 20.1 mpg with standard deviation 2.45 mpg. The sample mean 20.1 exceeds 19.8, but perhaps the increase is only a result of sampling error. a. Perform the relevant test of hypotheses at the 20% level of significance using the critical value approach. b. C. Compute the observed significance of...
Congress regulates corporate fuel economy and sets an annual gas mileage for cars. A company with...
Congress regulates corporate fuel economy and sets an annual gas mileage for cars. A company with a large fleet of cars hopes to meet the goal of 41.4 mpg or better for their fleet of cars. To see if the goal is being met, they check the gasoline usage for 40 company trips chosen at random, finding a mean of 42.40 mpg and a standard deviation of 2.46 mpg. Is this strong evidence that they have attained their fuel economy...
In the year 2000, the average car had a fuel economy of 23.2 MPG. You are...
In the year 2000, the average car had a fuel economy of 23.2 MPG. You are curious as to whether the average in the present day is less than the historical value. The hypotheses for this scenario are as follows: Null Hypothesis: μ ≥ 23.2, Alternative Hypothesis: μ < 23.2. If the true average fuel economy today is 38 MPG and the null hypothesis is not rejected, did a type I, type II, or no error occur? Question 13 options:...
Fach year the US Environmental Protection Agency (EPA) releases fuel economy data on cars manufactured in...
 Fach year the US Environmental Protection Agency (EPA) releases fuel economy data on cars manufactured in that year. Below are summary statistics on fuel efficiency (in miles/gallon) from a random sample of cars with manual transmissions and a random sample of cars with automatic transmissions manufactured in 2012. Assume that conditions for inference are satisfied City MPG Automatic Manual 16.12 19.85 3.58 4.51 Mean SD automatic manual City MPG (a) Compute the standard error (SE) of the difference of the...
You are curious about the average number of yards Matthew Stafford throws for each game for...
You are curious about the average number of yards Matthew Stafford throws for each game for the Detroit Lions. You randomly select 23 games and see that the average yards per game is 344.5 with a standard deviation of 27.8 yards. You want to create a 95% confidence interval for the true average number of yards per game he throws. What is the margin of error for this estimate? Question 1 options: 1) 1.5833 2) 5.7967 3) 12.0216 4) 9.9538...
problems 4, 5, 6, 11 and 13 If the population standard deviation was doubled to 10.4...
 problems 4, 5, 6, 11 and 13
If the population standard deviation was doubled to 10.4 and the level of confidence remained at 90%, what would be the new margin of error and confidence interval Margin of error, E. Confidence interval: 20.11<x<34.31 O Did the confidence interval increase or decrease and why? increase 4. Definition of Confidence Intervals (Section 6.1) Circle your answer, True of False. • A 99% confidence interval means that there is a 99% probability that the...
problems 4, 5, 6, 11 and 13
If the population standard deviation was doubled to 10.4 and the level of confidence remained at 90%, what would be the new margin of error and confidence interval Margin of error, E. Confidence interval: 20.11<x<34.31 O Did the confidence interval increase or decrease and why? increase 4. Definition of Confidence Intervals (Section 6.1) Circle your answer, True of False. • A 99% confidence interval means that there is a 99% probability that the...
 8. In a recent year the fuel economy of all passenger vehicles was 19.8 mpg. A trade organization sampled 50 passenger vehicles for fuel economy and obtained a sample mean of 20.1 mpg with standard deviation 2.45 mpg. The sample mean 20.1 exceeds 19.8, but perhaps the increase is only a result of sampling error. a. Perform the relevant test of hypotheses at the 20% level of significance using the critical value approach. b. C. Compute the observed significance of...
 Fach year the US Environmental Protection Agency (EPA) releases fuel economy data on cars manufactured in that year. Below are summary statistics on fuel efficiency (in miles/gallon) from a random sample of cars with manual transmissions and a random sample of cars with automatic transmissions manufactured in 2012. Assume that conditions for inference are satisfied City MPG Automatic Manual 16.12 19.85 3.58 4.51 Mean SD automatic manual City MPG (a) Compute the standard error (SE) of the difference of the...
 problems 4, 5, 6, 11 and 13
If the population standard deviation was doubled to 10.4 and the level of confidence remained at 90%, what would be the new margin of error and confidence interval Margin of error, E. Confidence interval: 20.11<x<34.31 O Did the confidence interval increase or decrease and why? increase 4. Definition of Confidence Intervals (Section 6.1) Circle your answer, True of False. • A 99% confidence interval means that there is a 99% probability that the...
problems 4, 5, 6, 11 and 13
If the population standard deviation was doubled to 10.4 and the level of confidence remained at 90%, what would be the new margin of error and confidence interval Margin of error, E. Confidence interval: 20.11<x<34.31 O Did the confidence interval increase or decrease and why? increase 4. Definition of Confidence Intervals (Section 6.1) Circle your answer, True of False. • A 99% confidence interval means that there is a 99% probability that the...
Most questions answered within 3 hours.
-
Calculate the pH of each of the following solutions.
0.50 M HBr
3.1×10⁻⁴ M KOH
4.2×10⁻⁵...
asked 1 hour ago -
For the year ended December 31, Depot Max’s cost of merchandise
sold was $85,600. Inventory at the...
asked 1 hour ago -
Week 10 - Professional Memo Assignment
Professional Memo Assignment
Your mission for this week, should you...
asked 1 hour ago -
Write a Python program that stores the data for each
player on the team, and it...
asked 1 hour ago -
In
the last 3 months, mike never knows when he is going to get his
allowance...
asked 1 hour ago -
Is Ca(OH)2 a Bronsted base, Lewis base, or both? Why?
asked 1 hour ago -
1A- Why don’t voters complain about U.S. tariffs on imported
sugar?
Because sugar is only a...
asked 1 hour ago -
Cash Payback Period
Primera Banco is evaluating two capital investment proposals for
a drive-up ATM kiosk,...
asked 1 hour ago -
Create a button in Swift (Xcode) that will create a charge,
create a charge using Stripe's...
asked 1 hour ago -
The reaction rate of CO and NO2 in the reaction
CO(g) + NO2(g) → CO2(g) +...
asked 1 hour ago -
Imagine that a chemist puts 6.40 mol each of
C3H8 and O2 in a 1.00-L container...
asked 1 hour ago -
How much money should be invested today in order to have $8340
at the end of...
asked 2 hours ago