all data is built in in R


5. 1 Run Reset Create a 99% confidence interval for the coefficient for Catholic. Report the upper bound of this interval. Enter answer here 6. 1 Run Reset 0 vs HBExamination Calculate the p-value of the test Ho : BExamination 0. Enter answer here
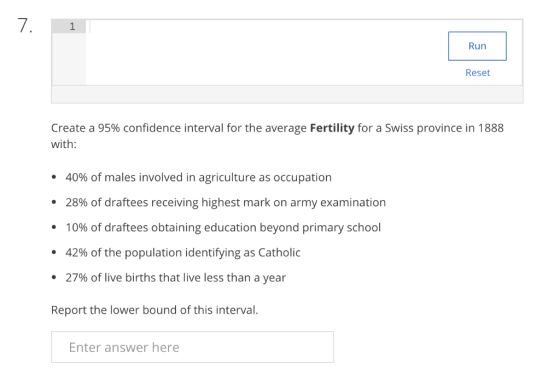
7. 1 Run Reset Create a 95% confidence interval for the average Fertility for a Swiss province in 1888 with: 40% of males involved in agriculture as occupation 28% of draftees receiving highest mark on army examination 10% of draftees obtaining education beyond primary school of the population identifying as Catholic 27% of live births that live less than a year Report the lower bound of this interval. Enter answer here
8. 1 Run Reset Create a 95% prediction interval for the Fertility of a Swiss province in 1888 with: 40% of males involved in agriculture as occupation 28% of draftees receiving highest mark on army examination 10% of draftees obtaining education beyond primary school 42% of the population identifying as Catholic 27% of live births that live less than a year Report the lower bound of this interval. Enter answer here
9. 1 Run Reset Report the value of the F statistic for the significance of regression test. Enter answer here 10. 1 Run Reset Carry out the significance of regression test using a = 0.01. What decision do you make? Fail to reject Ho Reject Ho Reject H1 Not enough information
11. 1 Run Reset Consider a model that only uses the predictors Education, Catholic, and Infant.Mortality. Use an F test to compare this with the model that uses all predictors. Report the p-value of this test. Enter answer here
Homework Answers
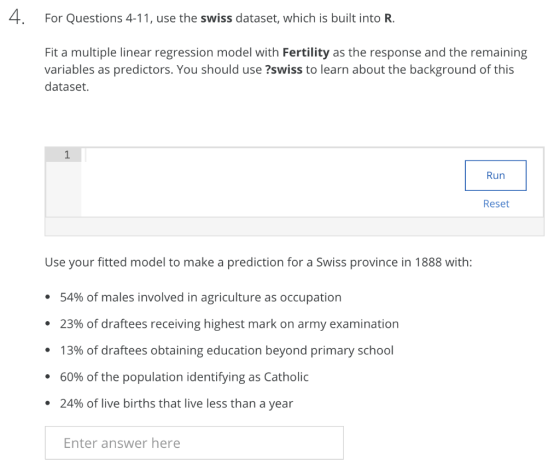
4)
data(swiss)
model <- lm(Fertility ~. , data= swiss)
summary(model)
summary(model)

Call:
lm(formula = Fertility ~ ., data = swiss)

Residuals:
     Min       1Q   Median       3Q      Max
-15.2743  -5.2617   0.5032   4.1198  15.3213

Coefficients:
                 Estimate Std. Error t value Pr(>|t|)
(Intercept)      66.91518   10.70604   6.250 1.91e-07 ***
Agriculture      -0.17211    0.07030  -2.448  0.01873 *
Examination      -0.25801    0.25388  -1.016  0.31546
Education        -0.87094    0.18303  -4.758 2.43e-05 ***
Catholic          0.10412    0.03526   2.953  0.00519 **
Infant.Mortality  1.07705    0.38172   2.822  0.00734 **
---
Signif. codes:  0 ‘***’ 0.001 ‘**’ 0.01 ‘*’ 0.05 ‘.’ 0.1 ‘ ’ 1

Residual standard error: 7.165 on 41 degrees of freedom
Multiple R-squared:  0.7067,    Adjusted R-squared:  0.671
F-statistic: 19.76 on 5 and 41 DF,  p-value: 5.594e-10
|
|
|
66.91518-0.17211*54 - 0.25801 * 23 -0.87094 * 13 + 0.10412 * 60 + 1.07705 * 24 [1] 72.46119 |
|
|
= 77.46119
6)
p-value = 0.3155
9)
F = 19.76
10)
p-value = 0.0000
we reject Ho
option B)
Please post rest questions again
You can use predict function for these question
Add Answer to:
all data is built in in R 4. For Questions 4-11, use the swiss dataset, which is built into R. Fit a multiple linear re...
For Questions 4-11, use the swiss dataset, which is built into R. Fit a multiple linear regression model with Fertility...
 For Questions 4-11, use the swiss dataset,
which is built into R.
Fit a multiple linear regression model with
Fertility as the response and the remaining
variables as predictors. You should use ?swiss to
learn about the background of this dataset.
7. 1 Run Reset Create a 95% confidence interval for the average Fertility for a Swiss province in 1888 with: 40% of males involved in agriculture as occupation 28% of draftees receiving highest mark on army examination 10% of...
For Questions 4-11, use the swiss dataset,
which is built into R.
Fit a multiple linear regression model with
Fertility as the response and the remaining
variables as predictors. You should use ?swiss to
learn about the background of this dataset.
7. 1 Run Reset Create a 95% confidence interval for the average Fertility for a Swiss province in 1888 with: 40% of males involved in agriculture as occupation 28% of draftees receiving highest mark on army examination 10% of...
For Questions 4-11, use the swiss dataset, which is built into R. Fit a multiple linear regression model with Fertility...
 For Questions 4-11, use the swiss dataset,
which is built into R.
Fit a multiple linear regression model with
Fertility as the response and the remaining
variables as predictors. You should use ?swiss to
learn about the background of this dataset.
9. 1 Run Reset Report the value of the F statistic for the significance of regression test. Enter answer here point 10. 1 Run Reset 0.01. What decision do Carry out the significance of regression test using a you...
For Questions 4-11, use the swiss dataset,
which is built into R.
Fit a multiple linear regression model with
Fertility as the response and the remaining
variables as predictors. You should use ?swiss to
learn about the background of this dataset.
9. 1 Run Reset Report the value of the F statistic for the significance of regression test. Enter answer here point 10. 1 Run Reset 0.01. What decision do Carry out the significance of regression test using a you...
For this exercise we will run a regression using Swiss demographic data from around 1888. The...
 For this exercise we will run a regression using Swiss demographic data from around 1888. The sample is a cross-section of French speaking counties in Switzerland This data come with the R package datasets. The first step is to load the package into your current environment by typing the command libraryldatasets) in to the R console. This loads a number of datasets including one called swiss. Type help/swiss) in the console for additional details. The basic variable definitions are as...
 For Questions 4-11, use the swiss dataset,
which is built into R.
Fit a multiple linear regression model with
Fertility as the response and the remaining
variables as predictors. You should use ?swiss to
learn about the background of this dataset.
7. 1 Run Reset Create a 95% confidence interval for the average Fertility for a Swiss province in 1888 with: 40% of males involved in agriculture as occupation 28% of draftees receiving highest mark on army examination 10% of...
For Questions 4-11, use the swiss dataset,
which is built into R.
Fit a multiple linear regression model with
Fertility as the response and the remaining
variables as predictors. You should use ?swiss to
learn about the background of this dataset.
7. 1 Run Reset Create a 95% confidence interval for the average Fertility for a Swiss province in 1888 with: 40% of males involved in agriculture as occupation 28% of draftees receiving highest mark on army examination 10% of...
 For Questions 4-11, use the swiss dataset,
which is built into R.
Fit a multiple linear regression model with
Fertility as the response and the remaining
variables as predictors. You should use ?swiss to
learn about the background of this dataset.
9. 1 Run Reset Report the value of the F statistic for the significance of regression test. Enter answer here point 10. 1 Run Reset 0.01. What decision do Carry out the significance of regression test using a you...
For Questions 4-11, use the swiss dataset,
which is built into R.
Fit a multiple linear regression model with
Fertility as the response and the remaining
variables as predictors. You should use ?swiss to
learn about the background of this dataset.
9. 1 Run Reset Report the value of the F statistic for the significance of regression test. Enter answer here point 10. 1 Run Reset 0.01. What decision do Carry out the significance of regression test using a you...
 For this exercise we will run a regression using Swiss demographic data from around 1888. The sample is a cross-section of French speaking counties in Switzerland This data come with the R package datasets. The first step is to load the package into your current environment by typing the command libraryldatasets) in to the R console. This loads a number of datasets including one called swiss. Type help/swiss) in the console for additional details. The basic variable definitions are as...
Most questions answered within 3 hours.
-
Describe two obstacles that makes fixing atmospheric nitrogen
difficult.
asked 1 minute from now -
T
F 53) Most differences
between human groups are the result of biology rather than
culture....
asked 2 minutes ago -
A 5.20 mW helium neon laser emits a visible laser beam with a
wavelength of 633...
asked 6 minutes ago -
Assignment:
Your
organization has made a strategic decision
to
outsourcework
currently performed in house. You have...
asked 4 minutes ago -
A hospital performs 100 surgeries per week. The probability that
complications after surgery occur is 10%....
asked 5 minutes ago -
In preparing its cash flow statement for the year ended December
31, 2018, Green Co. gathered...
asked 7 minutes ago -
Donna is 18 years old and full time accounting student.She is
saving for an overseas holiday...
asked 7 minutes ago -
Service-oriented architectures (SOA) provide
object-oriented architectures for web platforms that represent a
collection of services. SOA...
asked 8 minutes ago -
Le Terroir Winery is considering an expansion project to produce
fine wines. The trial expansion will...
asked 17 minutes ago -
The Bahraini public budget experiences deficit in the last
seven years, what are procedures are taken...
asked 24 minutes ago -
You invested $30,000 in a mutual fund at the beginning of the
year when the NAV...
asked 27 minutes ago -
Would you expect the price elasticity of supply for guitars to
be more inelastic in the...
asked 29 minutes ago