
Homework Answers
(a) Savings (S) = DI - C
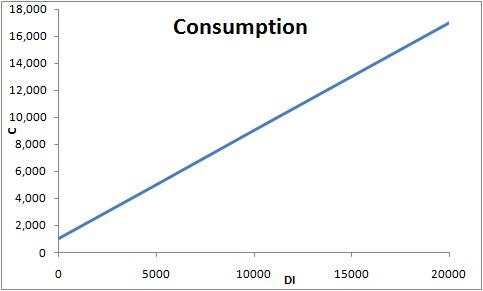
| DI | C | S | APC | APS |
| 0 | 1,000 | -1000 | ||
| 5,000 | 5,000 | 0 | 1 | 0 |
| 10,000 | 9,000 | 1000 | 0.9 | 0.1 |
| 15,000 | 13,000 | 2000 | 0.87 | 0.13 |
| 20,000 | 17,000 | 3000 | 0.85 | 0.15 |
(b)
MPC = Change in C / Change in DI = (5,000 - 1,000) / (5,000 - 0) = 4,000/5,000 = 0.8
MPS = 1 - MPC = 1 - 0.8 = 0.2
(c)
APC = C / DI
APS = S / DI, computed above.
(d)
At breakeven DI,
DI = C
This holds true when DI = C = 5,000
(e)
When DI = 0, C = 4,000, which is autonomous consumption.
(f)
(g)

Add Answer to:
4. Given the following income, spending and savings data, please answer the questions below: Disposable Income (DI)...
. YOU ARE GIVEN THE FOLLOWING INFORMATION ABOUT THE ECONOMY OF ENGLAND. PLEASE ANSWER QUESTIONS A...
 . YOU ARE GIVEN THE FOLLOWING INFORMATION ABOUT THE ECONOMY OF ENGLAND. PLEASE ANSWER QUESTIONS A THROUGH C AND SHOW ALL WORK AND CALCULATIONS BELOVW DISPOSABLE INCOME CONSUMPTION (BILLIONS OF DOLLARS PER YEAR) $200 $100 S20 S30 $40 S360 $440 S520 A CALCULATE THE MARGINAL PROPENSITY TO CONSUME(MPC) AT EACH LEVEL OF DISPOSABLE INCOME AND CONSUMPTION LEVEL. INTERPET WHAT THE MPC NUMBER YO CALCULATED MEANS TO YO B. CALCULATE SAVINGS AT EACH LEVEL OF DISPOSABLE INCOME AND CONSUMPTION LEVEL. c....
The table below shows the after-tax income and consumption spending for a nation. a. Calculate the...
 The table below shows the after-tax income and consumption spending for a nation. a. Calculate the dollar amount of savings, the marginal propensity to consurfe (MPC), and the marginal propensity to save (MPS) for each level of income. Instructions: Enter your answers for savings as a whole number. Round your answers for MPC and MPS to two decimal places. After-Tax Income and Consumption Spending Consumption Spending (dollars) $9,540 After-Tax Income (dollars) $18,700 Savings (dollars) MPC MPS $ 23,640 13,860 19,180...
Please explain why questions 36-39 are the answers they are and show the work. We were...
 Please explain why questions 36-39 are the answers they are and
show the work.
We were unable to transcribe this image38. At the $450 level of disposable income, a) marginal propensity to consume is 1; b) marginal propensity to save is 0; c) average propensity to consume is 0.8; d) average propensity to save is 0 Answer: Correct Answer: At all levels of DI, MPC is 40/50-0.8 and MPS is 0.2. At the $450 level of disposable income c) APC...
Please explain why questions 36-39 are the answers they are and
show the work.
We were unable to transcribe this image38. At the $450 level of disposable income, a) marginal propensity to consume is 1; b) marginal propensity to save is 0; c) average propensity to consume is 0.8; d) average propensity to save is 0 Answer: Correct Answer: At all levels of DI, MPC is 40/50-0.8 and MPS is 0.2. At the $450 level of disposable income c) APC...
The consumption function is given by the equation: C = 400 + 0.8(Yd) where C =...
The consumption function is given by the equation: C = 400 + 0.8(Yd) where C = consumption and Yd = disposable income. Currently, the level of disposable income is $5000. What is the current level of consumption? What is the current level of saving? What is the MPC? What is the MPS? Calculate the APC and the APS. 6. We are given the following information about the levels of disposable income and savings: Disposable Income Consumption Savings APC APS MPC...
macroeconomics
Compute for the average propensity to consume and to save, and compute for the marginal propensity to consume and to save. - Also the new levels of average propensity to consume and to save after the change. Assuming that \(Y\) or \(Y d=P 1250\) and \(C=P 1000,\) compute for APC \(\&\) APS and interpret each. Disposable income increased by \(\mathrm{P} 525\) which caused consumption spending to increase by \(\mathrm{P} 330\), compute the MPC \& MPS, and the new levels of APC \& APS after the...
economics
Q-3: a) You are given the following information about an Economy: (08 Marks) Disposable Income (dollars per year)Consumption Expenditure (dollars per year)050001000010000200001500030000200004000025000 Calculate the Economy’s Marginal Propensity to Consume (MPC).Calculate the Economy’s Average Propensity to Consume (APC) at each level of Disposable Income.
Use the table below to answer the question. Disposable Income $10.000 $20,000 $30,000 $40.000 Consumption $12,000...
 Use the table below to answer the question. Disposable Income $10.000 $20,000 $30,000 $40.000 Consumption $12,000 $20.000 $28,000 $36.000 The marginal propensity to save (MPS) is equal to and the marginal propensity to consume (MPC) is equal to 0.2:0.8 O 0.25:0.75 O 0.75:0.25 O 0.8:0.2 Use the table below to answer the question. Disposable Income $10,000 $20,000 $30,000 $40,000 Consumption $12,000 $20,000 $28,000 $36,000 Autonomous consumptly is equal to: $1,000 O $4,000. O $10,000. O $12,000.
Suppose the following table describes the relation of consumption spending to the disposable income Disposable Income...
 Suppose the following table describes the relation of consumption spending to the disposable income Disposable Income (Yp)|400 500 600 700 800 Consumption ( 390 470 550 630 710 (a) Derive the consumption function. Explain the two components of (e) What is the level of saving when the level of income equals to $900, to $350, to $300? Redraw the graphs from points (a) and (d) and show the areas of saving and dissaving. (f) Suppose income grows from $850 to...
Year The accompanying table presents hypothetical data on aggregate consumption expenditure and disposable income in millions...
 Year The accompanying table presents hypothetical data on aggregate consumption expenditure and disposable income in millions of dollars over five years. Disposable income (in millions) Consumption expenditure (in millions) 175 2013 200 2014 225 2015 280 193.75 235 268.75 250 2016 325 2017 300 a. What is the marginal propensity to consume (MPC)? MPC: b. What is the marginal propensity to save (MPS)? MPS:
 . YOU ARE GIVEN THE FOLLOWING INFORMATION ABOUT THE ECONOMY OF ENGLAND. PLEASE ANSWER QUESTIONS A THROUGH C AND SHOW ALL WORK AND CALCULATIONS BELOVW DISPOSABLE INCOME CONSUMPTION (BILLIONS OF DOLLARS PER YEAR) $200 $100 S20 S30 $40 S360 $440 S520 A CALCULATE THE MARGINAL PROPENSITY TO CONSUME(MPC) AT EACH LEVEL OF DISPOSABLE INCOME AND CONSUMPTION LEVEL. INTERPET WHAT THE MPC NUMBER YO CALCULATED MEANS TO YO B. CALCULATE SAVINGS AT EACH LEVEL OF DISPOSABLE INCOME AND CONSUMPTION LEVEL. c....
 The table below shows the after-tax income and consumption spending for a nation. a. Calculate the dollar amount of savings, the marginal propensity to consurfe (MPC), and the marginal propensity to save (MPS) for each level of income. Instructions: Enter your answers for savings as a whole number. Round your answers for MPC and MPS to two decimal places. After-Tax Income and Consumption Spending Consumption Spending (dollars) $9,540 After-Tax Income (dollars) $18,700 Savings (dollars) MPC MPS $ 23,640 13,860 19,180...
 Please explain why questions 36-39 are the answers they are and
show the work.
We were unable to transcribe this image38. At the $450 level of disposable income, a) marginal propensity to consume is 1; b) marginal propensity to save is 0; c) average propensity to consume is 0.8; d) average propensity to save is 0 Answer: Correct Answer: At all levels of DI, MPC is 40/50-0.8 and MPS is 0.2. At the $450 level of disposable income c) APC...
Please explain why questions 36-39 are the answers they are and
show the work.
We were unable to transcribe this image38. At the $450 level of disposable income, a) marginal propensity to consume is 1; b) marginal propensity to save is 0; c) average propensity to consume is 0.8; d) average propensity to save is 0 Answer: Correct Answer: At all levels of DI, MPC is 40/50-0.8 and MPS is 0.2. At the $450 level of disposable income c) APC...
 Use the table below to answer the question. Disposable Income $10.000 $20,000 $30,000 $40.000 Consumption $12,000 $20.000 $28,000 $36.000 The marginal propensity to save (MPS) is equal to and the marginal propensity to consume (MPC) is equal to 0.2:0.8 O 0.25:0.75 O 0.75:0.25 O 0.8:0.2 Use the table below to answer the question. Disposable Income $10,000 $20,000 $30,000 $40,000 Consumption $12,000 $20,000 $28,000 $36,000 Autonomous consumptly is equal to: $1,000 O $4,000. O $10,000. O $12,000.
 Suppose the following table describes the relation of consumption spending to the disposable income Disposable Income (Yp)|400 500 600 700 800 Consumption ( 390 470 550 630 710 (a) Derive the consumption function. Explain the two components of (e) What is the level of saving when the level of income equals to $900, to $350, to $300? Redraw the graphs from points (a) and (d) and show the areas of saving and dissaving. (f) Suppose income grows from $850 to...
 Year The accompanying table presents hypothetical data on aggregate consumption expenditure and disposable income in millions of dollars over five years. Disposable income (in millions) Consumption expenditure (in millions) 175 2013 200 2014 225 2015 280 193.75 235 268.75 250 2016 325 2017 300 a. What is the marginal propensity to consume (MPC)? MPC: b. What is the marginal propensity to save (MPS)? MPS:
Most questions answered within 3 hours.
-
A training program has been developed to train Managers on how
to keep control over their...
asked 10 minutes ago -
On
Jan 2, 2019 a firm purchased equipment for $10,000. Depreciation
expensefor the year ending December31,...
asked 14 minutes ago -
in Malaysia:
(a) Select THREE (3) items that are not included in the
calculation of GDP...
asked 13 minutes ago -
You own an oil pipeline that will generate a $2 million cash
return over the coming...
asked 13 minutes ago -
According to a study by Kanishka Misra of the University of
Michigan and Paolo Surico of...
asked 16 minutes ago -
You are camping at the top of a mountain (altitude=700 m).
Returning from the lake (altitude=500...
asked 16 minutes ago -
1) The demand for the Tesla electric automobile is P = 200,000 –
2.1 Q, where...
asked 21 minutes ago -
The pH of a 50.0 mL sample of a buffer changed by one unit when
6.12...
asked 45 minutes ago -
Determine the amount of sales (units) that would be necessary
under
Break-Even Sales Under Present and...
asked 30 minutes ago -
1. Why do you think that the first thing you learn about in a
Biology course...
asked 29 minutes ago -
A pendulum has a length of 64.5m. How many times does it move
back and forth...
asked 42 minutes ago -
A constant electric field accelerates a proton from rest through
a distance of 1.65 m to...
asked 46 minutes ago