

Homework Answers

Add Answer to:
Suppose the following table describes the relation of consumption spending to the disposable income Disposable Income...
4. Given the following income, spending and savings data, please answer the questions below: Disposable Income (DI)...
 4. Given the following income, spending and savings data, please answer the questions below: Disposable Income (DI) Consumption (C) Savings (S) $ 0 $ 1000 $ 5000 $ 5000 $10000 $15000 $20000 $ 9000 $13000 $17000 a. Solve for savings at each level of disposable income (DI). b. Solve for the marginal propensity to consume (MPC) and the marginal propensity to save (MPS) between each disposable income level. d. Solve for the average propensity to consumer (APC) and the average...
Consider the following table for a? household's consumption expenditures and disposable income. To the nearest? dollar,...
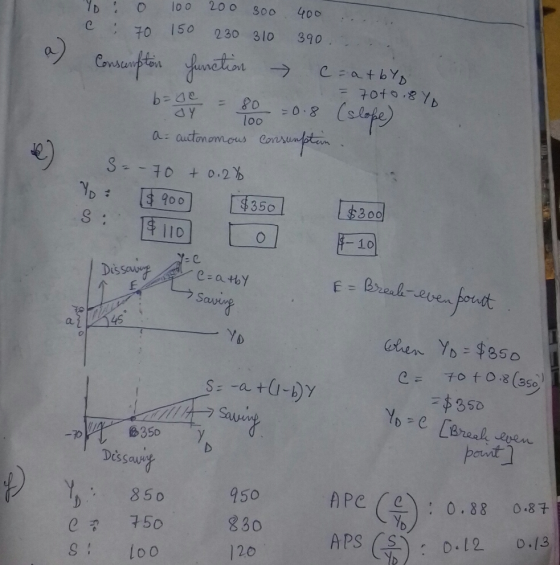
Consider the following table for a? household's consumption expenditures and disposable income. To the nearest? dollar, compute desired saving at each level of disposable income. ?(Enter your responses as whole numbers and include a minus sign where? appropriate.) Income Consumption Savings ?$0 ?$100 ?$ ?$100 ?$150 ?$ ?$200 ?$200 ?$ ?$300 ?$250 ?$ ?$400 ?$300 ?$ ?$500 ?$350 ?$ The marginal propensity to save is ____. ?(Enter your response rounded to two decimal? places.) The marginal propensity to save ____...
Macroeconomics Assignment 2 1. The table shows disposable income and consumption expenditure in an economy. Use...
 Macroeconomics Assignment 2 1. The table shows disposable income and consumption expenditure in an economy. Use the table to work Problems A and B. Disposable Consumption income expenditure (Billions of dollars) 800 1,000 A. Calculate saving at each level of disposable income. Over what range of disposable income does consumption expenditure exceed disposable income? Calculate autonomous consumption expenditure. B. Calculate the marginal propensity to consume. At what level of disposable income will savings be zero? If expected future income increases,...
Economists refer to the simple relationship between consumption and disposable income as: autonomous consumption. the marginal...
Economists refer to the simple relationship between consumption and disposable income as: autonomous consumption. the marginal propensity to consume. the absolute disposable income hypothesis. disposable income. the consumption function.
In an economy, when disposable income increases from $400 to $500, consumption expenditure increases from $420...
 In an economy, when disposable income increases from $400 to $500, consumption expenditure increases from $420 billion to $500. Calculate the marginal propensity to consume, the change in saving, and the marginal propensity to save. The marginal propensity to consume is 0.80. >>> Answer to 2 decimal places. When disposable income increases from $400 billion to $500 billion, saving increases by $ 20 billion. The marginal propensity to save is 0.20 >>> Answer to 2 decimal places.
For a hypothetical economy, suppose the consumption equation is C = 30 + 0.65Y, where C...
For a hypothetical economy, suppose the consumption equation is C = 30 + 0.65Y, where C is households’ consumption and Y is disposable income. If the disposable income is $600, carefully show your steps and calculate: The levels of (i) consumption and (ii) saving. The marginal propensity to (i) consume and (ii) save. The average propensity to (i) consume and (ii) save. Interpret your estimates in (c).
Use the table below to answer the question. Disposable Income $10.000 $20,000 $30,000 $40.000 Consumption $12,000...
 Use the table below to answer the question. Disposable Income $10.000 $20,000 $30,000 $40.000 Consumption $12,000 $20.000 $28,000 $36.000 The marginal propensity to save (MPS) is equal to and the marginal propensity to consume (MPC) is equal to 0.2:0.8 O 0.25:0.75 O 0.75:0.25 O 0.8:0.2 Use the table below to answer the question. Disposable Income $10,000 $20,000 $30,000 $40,000 Consumption $12,000 $20,000 $28,000 $36,000 Autonomous consumptly is equal to: $1,000 O $4,000. O $10,000. O $12,000.
Allison disposable income is $90,000, her autonomous consumption is $15,000 and her Marginal Propensity to Consume...
Allison disposable income is $90,000, her autonomous consumption is $15,000 and her Marginal Propensity to Consume is 0.80, how much money is Allison saving? Select one: a. She is saving $3,000 b. She is saving $7,000 c. She is saving $10,000 d. She is saving $12,000 e. She is saving $15,000
Suppose Ginny gets a sales bonus at her place of work that gives her an extra $600 of disposable income. She chooses to...
Suppose Ginny gets a sales bonus at her place of work that gives her an extra $600 of disposable income. She chooses to spend $360 and save the remaining $240. From this, you can tell that Ginnys marginal propensity to consume (MPC) is ______ and her marginal propensity to save is ____ Mathematically, it must always be true that: Saving = Disposable Income + Consumption Consumption - Disposable Income Disposable Income - Consumption Therefore, it must also be true that:...
 4. Given the following income, spending and savings data, please answer the questions below: Disposable Income (DI) Consumption (C) Savings (S) $ 0 $ 1000 $ 5000 $ 5000 $10000 $15000 $20000 $ 9000 $13000 $17000 a. Solve for savings at each level of disposable income (DI). b. Solve for the marginal propensity to consume (MPC) and the marginal propensity to save (MPS) between each disposable income level. d. Solve for the average propensity to consumer (APC) and the average...
 Macroeconomics Assignment 2 1. The table shows disposable income and consumption expenditure in an economy. Use the table to work Problems A and B. Disposable Consumption income expenditure (Billions of dollars) 800 1,000 A. Calculate saving at each level of disposable income. Over what range of disposable income does consumption expenditure exceed disposable income? Calculate autonomous consumption expenditure. B. Calculate the marginal propensity to consume. At what level of disposable income will savings be zero? If expected future income increases,...
 In an economy, when disposable income increases from $400 to $500, consumption expenditure increases from $420 billion to $500. Calculate the marginal propensity to consume, the change in saving, and the marginal propensity to save. The marginal propensity to consume is 0.80. >>> Answer to 2 decimal places. When disposable income increases from $400 billion to $500 billion, saving increases by $ 20 billion. The marginal propensity to save is 0.20 >>> Answer to 2 decimal places.
 Use the table below to answer the question. Disposable Income $10.000 $20,000 $30,000 $40.000 Consumption $12,000 $20.000 $28,000 $36.000 The marginal propensity to save (MPS) is equal to and the marginal propensity to consume (MPC) is equal to 0.2:0.8 O 0.25:0.75 O 0.75:0.25 O 0.8:0.2 Use the table below to answer the question. Disposable Income $10,000 $20,000 $30,000 $40,000 Consumption $12,000 $20,000 $28,000 $36,000 Autonomous consumptly is equal to: $1,000 O $4,000. O $10,000. O $12,000.
Most questions answered within 3 hours.
-
Please use python to explain.
Assume that the variables x and
y refer to strings. Write...
asked 4 minutes ago -
This table shows the US domestic demand and supply schedules
for oranges. Suppose the world price...
asked 3 minutes ago -
Please help me create a CLASS DIAGRAM for this code:
import pygame
from pygame.sprite import Sprite...
asked 5 minutes ago -
The Merriweather Printing Company is trying to decide on the
merits of constructing a new publishing...
asked 24 minutes ago -
29) Insulin is a water-soluble hormone transported in the blood.
Which describes a likely way in...
asked 31 minutes ago -
Harden, Harden, & Harden is a venerable Wall Street stock
brokerage firm. It has its business...
asked 31 minutes ago -
How do we determine the ultimate radioactive decay product of
the uranium-238 series is lead?
asked 35 minutes ago -
> Women’s pulse rates are normally distributed with a mean of
68.5 beats per minute and...
asked 42 minutes ago -
Briefly describe an aspect of the strengths perspective that is
consistent with your own understanding of...
asked 44 minutes ago -
Step by step method of using Sparse Identification of Nonlinear
Dynamics (SINDy) to model your own...
asked 52 minutes ago -
3) What are the typical social structures in a global city?
asked 3 hours ago -
Luther Corporation
Consolidated Balance Sheet
December 31, 2019 and 2018 (in $ millions)
Assets
2019
2018...
asked 3 hours ago