The accompanying table contains data on the weight, in grams, of a sample of 50 tea bags produced during an eight-hou...
The accompanying table contains data on the weight, in grams, of a sample of 50 tea bags produced during an eight-hour shift. Complete parts (a) through (d).
a. Is there evidence that the mean amount of tea per bag is
different from 5.5 grams? (Use alpha = 0.05.)
ALSO STATE THE NULL AND ALTERNATIVE HYPOTHESIS:
DETERMINE TEST STATISTIC:
The test statistic is
(Round to two decimal places as needed.)
FIND THE P-VALUE:
p-value =
(Round to three decimal places as needed.)
STATE THE CONCLUSION:
Upper H 0. There is ▼ sufficient OR insufficient evidence to
conclude that the mean difference is not equal to 5.5 inches.
b. Construct a 95% confidence interval estimate of the
population mean amount of tea per bag. Interpret this
interval.
The 95% confidence interval is:
(Round to four decimal places as needed.)
Interpret the 95% confidence interval. Choose the correct
answer below.
A. Do not reject Upper H 0 because the hypothesized mean is
contained within the confidence interval.
B. Reject Upper H 0 because the hypothesized mean is not contained
within the confidence interval.
C. Reject Upper H 0 because the hypothesized mean is contained
within the confidence interval.
D. Do not reject Upper H 0 because the hypothesized mean is not
contained within the confidence interval.
c. Compare the conclusions reached in (a) and (b). Choose the
correct answer below.
A. The confidence interval and hypothesis test both show that there
is sufficient evidence that the mean amount of tea per bag is
different from 5.5 grams.
B. The confidence interval shows insufficient evidence while the
hypothesis test shows sufficient evidence that the mean amount of
tea per bag is different from 5.5 grams.
C. The confidence interval shows sufficient evidence while the
hypothesis test shows insufficient evidence that the mean amount of
tea per bag is different from 5.5 grams.
D. The confidence interval and hypothesis test both show that there
is insufficient evidence that the mean amount of tea per bag is
different from 5.5 grams.
| 5.65 |
| 5.44 |
| 5.41 |
| 5.41 |
| 5.54 |
| 5.34 |
| 5.54 |
| 5.45 |
| 5.51 |
| 5.42 |
| 5.55 |
| 5.41 |
| 5.51 |
| 5.53 |
| 5.54 |
| 5.64 |
| 5.54 |
| 5.47 |
| 5.44 |
| 5.51 |
| 5.46 |
| 5.42 |
| 5.46 |
| 5.62 |
| 5.53 |
| 5.31 |
| 5.68 |
| 5.28 |
| 5.48 |
| 5.56 |
| 5.77 |
| 5.56 |
| 5.41 |
| 5.58 |
| 5.59 |
| 5.51 |
| 5.32 |
| 5.48 |
| 5.53 |
| 5.57 |
| 5.61 |
| 5.44 |
| 5.43 |
| 5.23 |
| 5.55 |
| 5.63 |
| 5.48 |
| 5.57 |
| 5.67 |
| 5.35 |
Homework Answers
 : mean amount of tea per bag
Null hypothesis : Ho :
=5.5
Alternate Hypothesis : Ha :
 5.5
5.5
Two tailed test.
Hypothesized mean :  = 5.5
= 5.5
x: sample data of weight in grams of tea in a bag
Sample mean : sample mean weight of tea per bag

n : Sample size = 50
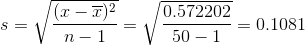
sample standard deviation :s

| x |
(x- ) ) |
(x-)2 |
|
|
5.65 |
0.1514 | 0.022922 | |
| 5.44 | -0.059 | 0.003434 | |
| 5.41 | -0.089 | 0.007850 | |
| 5.41 | -0.089 | 0.007850 | |
| 5.54 | 0.0414 | 0.001714 | |
| 5.34 | -0.159 | 0.025154 | |
| 5.54 | 0.0414 | 0.001714 | |
| 5.45 | -0.049 | 0.002362 | |
| 5.51 | 0.0114 | 0.000130 | |
| 5.42 | -0.079 | 0.006178 | |
| 5.55 | 0.0514 | 0.002642 | |
| 5.41 | -0.089 | 0.007850 | |
| 5.51 | 0.0114 | 0.000130 | |
| 5.53 | 0.0314 | 0.000986 | |
| 5.54 | 0.0414 | 0.001714 | |
| 5.64 | 0.1414 | 0.019994 | |
| 5.54 | 0.0414 | 0.001714 | |
| 5.47 | -0.029 | 0.000818 | |
| 5.44 | -0.059 | 0.003434 | |
| 5.51 | 0.0114 | 0.000130 | |
| 5.46 | -0.039 | 0.001490 | |
| 5.42 | -0.079 | 0.006178 | |
| 5.46 | -0.039 | 0.001490 | |
| 5.62 | 0.1214 | 0.014738 | |
| 5.53 | 0.0314 | 0.000986 | |
| 5.31 | -0.189 | 0.035570 | |
| 5.68 | 0.1814 | 0.032906 | |
| 5.28 | -0.219 | 0.047786 | |
| 5.48 | -0.019 | 0.000346 | |
| 5.56 | 0.0614 | 0.003770 | |
| 5.77 | 0.2714 | 0.073658 | |
| 5.56 | 0.0614 | 0.003770 | |
| 5.41 | -0.089 | 0.007850 | |
| 5.58 | 0.0814 | 0.006626 | |
| 5.59 | 0.0914 | 0.008354 | |
| 5.51 | 0.0114 | 0.000130 | |
| 5.32 | -0.179 | 0.031898 | |
| 5.48 | -0.019 | 0.000346 | |
| 5.53 | 0.0314 | 0.000986 | |
| 5.57 | 0.0714 | 0.005098 | |
| 5.61 | 0.1114 | 0.012410 | |
| 5.44 | -0.059 | 0.003434 | |
| 5.43 | -0.069 | 0.004706 | |
| 5.23 | -0.269 | 0.072146 | |
| 5.55 | 0.0514 | 0.002642 | |
| 5.63 | 0.1314 | 0.017266 | |
| 5.48 | -0.019 | 0.000346 | |
| 5.57 | 0.0714 | 0.005098 | |
| 5.67 | 0.1714 | 0.029378 | |
| 5.35 | -0.149 | 0.022082 | |
| Total | 274.93 |
 =0.572202 =0.572202 |
|
|
Mean:
=274.93/50 |
5.4986 |

The test statistic = -0.0915
Fro two tailed test:

for 49 degrees of freedom , P(t>0.0915) = 0.4637
p-value = 2xP(t>0.0915) = 2x0.4637=0.9274
p-value = 0.9274
As P-Value i.e. is greater than Level of
significance i.e (P-value:0.9275 > 0.05:Level of significance);
Fail to Reject Null Hypothesis
There is insufficient evidence to conclude that the
mean difference is not equal to 5.5 inches
b. Construct a 95% confidence interval estimate of the population mean amount of tea per bag. Interpret this interval.
confidence interval estimate of the population mean

 for 95% confidence level =(100-95)/100=0.05
/2
=0.05/2=0.025

95% confidence interval estimate of the population mean amount of tea per bag
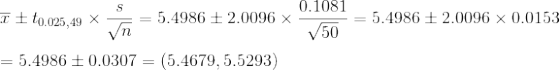
The 95% confidence interval is:(5.4679,5.5293)
Interpret the 95% confidence interval. Choose the correct
answer below.
A. Do not reject H0 because the hypothesized
mean is contained within the confidence interval.
c. Compare the conclusions reached in (a) and (b). Choose the correct answer below.
D. The confidence interval and hypothesis test both show that there is insufficient evidence that the mean amount of tea per bag is different from 5.5 grams.
Add Answer to:
The accompanying table contains data on the weight, in grams, of a sample of 50 tea bags produced during an eight-hou...
HUMEWUIK. ASSIYellow Clapely Score: 0 of 3 pts 11 of 13 (10 complete) 9.2.34-T The accompanying...
 HUMEWUIK. ASSIYellow Clapely Score: 0 of 3 pts 11 of 13 (10 complete) 9.2.34-T The accompanying table contains data on the weight in grams of a sample of 50 tea bags produced during an eight hour shit Complete parts (a) through (d) Click the icon to view the data table a. Is there evidence that the mean amount of tea per bag is different from 55 grams (Use a 0 10 ) State the null and alternative hypotheses HOP- H,...
A filling machine for a tea bag manufacturer produces approximately 170 teabags per minute. The process manager monitors the weight of the tea placed in individual bags. A sample of observations is t...
 A filling machine for a tea bag manufacturer produces approximately 170 teabags per minute. The process manager monitors the weight of the tea placed in individual bags. A sample of observations is taken in 10 consecutive time periods. The results are shown below: Sample 10 2 4 6 5.44 5.61 5.49 5.58 5.29 5.42 5.50 5.44 5.41 5.55 5.51 5.53 5.32 5.77 5.50 5.61 5.63 5.44 5.54 5.40 5.56 5.40 5.67 5.57 5.32 5.45 5.50 5.42 5.45 5.53 5.46 5.47...
8.2.19-T The table below contains the overall miles per gallon (MPG) of a type of vehicle...
 8.2.19-T The table below contains the overall miles per gallon (MPG) of a type of vehicle Complete parts a and b below 24 24 20 26 24 29 35 23 28 20 44 31 25 22 a. Construct a 95% confidence interval estimate for the population mean MPG for this type of vehicle, assuming a normal distribution The 95% confidence interval estimate is from (Round to one decimal place as needed) MPG to MPG 8.EOC.57-E Question Help A consulting firm...
A quality characteristic of interest for a tea-bag-filling process is the weight of the tea in...
A quality characteristic of interest for a tea-bag-filling process is the weight of the tea in the individual bags. The label weight on the package indicates that the mean amount is 5.64 grams of tea in a bag. Problems arise if the bags are underfilled or if the mean amount of tea in a bag exceeds the label weight. The accompanying data are the weights, in grams, of a sample of 50 tea bags produced in one hour by a...
8of 14 (11 complete) HW Sco 9.2.34-T on the weight,in grams, of a sample of 50...
 8of 14 (11 complete) HW Sco 9.2.34-T on the weight,in grams, of a sample of 50 tea bags produced during an eight-hour shift Complete parts (a) hrough (d). EEE Click the icon to view the data table. State the null and alternative hypotheses Ho : 5.5 H H 55 Type integers or decimals.) Determine the test statistic The test statistic is 0.21 Round to two decimal places as needed.) Find the p-value. More Into Tea Bag Weight (in grams) 64...
A random sample of 22 STAT 250 students was collected and the file size of Data...
A random sample of 22 STAT 250 students was collected and the file size of Data Analysis 2 was recorded. The data was measured in megabytes. The instructors of the course claim that the file size will be different from 5 megabytes. Consider the population of all file sizes to be right-skewed. Using a = 0.01, is there sufficient evidence to conclude that the mean file size of Data Analysis 2 is different from 5 megabytes? Conduct a full hypothesis...
A coffee company sells bags of coffee beans with an advertised weight of 454 grams. A...
A coffee company sells bags of coffee beans with an advertised weight of 454 grams. A random sample of 20 bags of coffee beans has an average weight of 457 grams. Weights of coffee beans per bag are known to follow a normal distribution with standard deviation 4 grams. (a) Construct a 95% confidence interval for the true mean weight of all bags of coffee beans. (Instead of typing ±, simply type +-.) (b) Provide an interpretation of the confidence...
The data for a random sample of six paired observations are shown in the table a....
 The data for a random sample of six paired observations are shown in the table a. Calculate and b. Express in terms of , and a c. Forma 99% confidence interval for d. Test the null hypothesis against the native hypothesis Us 0.01 Calculate the difference between each pair of observations by racing bein tromber (Round to two decimal places as needed) Calculates (Round to two decimal places as needed.) The data for a random sample of six paired observations...
Refer to data table below, which shows the amounts of nicotine (mg per cigarette) in king size, 100 mm menthol, and 100 mm nonmenthol cigarettes. The king size cigarettes are nonfiltered, while...
Refer to data table below, which shows the amounts of nicotine (mg per cigarette) in king size, 100 mm menthol, and 100 mm nonmenthol cigarettes. The king size cigarettes are nonfiltered, while the 100 mm menthol and the 100 mm nonmenthol cigarettes are filtered. Use a 0.05 significance level to test the claim that the three categories of cigarettes yield the same mean amount of nicotine. Given that only the king size cigarettes are not filtered, do the filters appear...
Listed in the data table are 10 scores for a random sample of subjects with medium...
 Listed in the data table are 10 scores for a random sample of subjects with medium load levels in their blood. Also listed are statistics from a study done of IQ scores for a random sample of subjects with high lead levels. Assume that the two samples are independent simple random samples selected from normally distributed populations. Do not assume that the population standard deviations are equal. Complete parts (a) and (b) below. Use a 0.05 significance level for both...
 HUMEWUIK. ASSIYellow Clapely Score: 0 of 3 pts 11 of 13 (10 complete) 9.2.34-T The accompanying table contains data on the weight in grams of a sample of 50 tea bags produced during an eight hour shit Complete parts (a) through (d) Click the icon to view the data table a. Is there evidence that the mean amount of tea per bag is different from 55 grams (Use a 0 10 ) State the null and alternative hypotheses HOP- H,...
 A filling machine for a tea bag manufacturer produces approximately 170 teabags per minute. The process manager monitors the weight of the tea placed in individual bags. A sample of observations is taken in 10 consecutive time periods. The results are shown below: Sample 10 2 4 6 5.44 5.61 5.49 5.58 5.29 5.42 5.50 5.44 5.41 5.55 5.51 5.53 5.32 5.77 5.50 5.61 5.63 5.44 5.54 5.40 5.56 5.40 5.67 5.57 5.32 5.45 5.50 5.42 5.45 5.53 5.46 5.47...
 8.2.19-T The table below contains the overall miles per gallon (MPG) of a type of vehicle Complete parts a and b below 24 24 20 26 24 29 35 23 28 20 44 31 25 22 a. Construct a 95% confidence interval estimate for the population mean MPG for this type of vehicle, assuming a normal distribution The 95% confidence interval estimate is from (Round to one decimal place as needed) MPG to MPG 8.EOC.57-E Question Help A consulting firm...
 8of 14 (11 complete) HW Sco 9.2.34-T on the weight,in grams, of a sample of 50 tea bags produced during an eight-hour shift Complete parts (a) hrough (d). EEE Click the icon to view the data table. State the null and alternative hypotheses Ho : 5.5 H H 55 Type integers or decimals.) Determine the test statistic The test statistic is 0.21 Round to two decimal places as needed.) Find the p-value. More Into Tea Bag Weight (in grams) 64...
 The data for a random sample of six paired observations are shown in the table a. Calculate and b. Express in terms of , and a c. Forma 99% confidence interval for d. Test the null hypothesis against the native hypothesis Us 0.01 Calculate the difference between each pair of observations by racing bein tromber (Round to two decimal places as needed) Calculates (Round to two decimal places as needed.) The data for a random sample of six paired observations...
 Listed in the data table are 10 scores for a random sample of subjects with medium load levels in their blood. Also listed are statistics from a study done of IQ scores for a random sample of subjects with high lead levels. Assume that the two samples are independent simple random samples selected from normally distributed populations. Do not assume that the population standard deviations are equal. Complete parts (a) and (b) below. Use a 0.05 significance level for both...
Most questions answered within 3 hours.
-
Strategy is an important part of project management and business
decisions. Define strategy and describe in...
asked 1 minute from now -
Task 5.2 Numerical Analysis Using Nested Loops (13 pts)
Consider the following program:
void setup()
{...
asked 11 minutes ago -
If a lossless transformer has 1000 turns for a primary winding
and 100 turns for the...
asked 20 minutes ago -
Write the net ionic equation for the precipitation reaction that
occurs when aqueous solutions of potassium...
asked 28 minutes ago -
it
should be written in c++
Your program should take numbers from the user until the...
asked 34 minutes ago -
Buses are powered by chemical reactions. Define matter and the
four states of matter. What is...
asked 52 minutes ago -
Use conservation of energy to find the velocity of a free point
charge q1 at 22cm...
asked 59 minutes ago -
First, describe policies promoted by governments of the
political right to address economic globalization. Second, describe...
asked 1 hour ago -
M2-9 Completing T-Accounts LO2-4
Following are the transactions of Dennen, Inc., for the month of
January....
asked 1 hour ago -
Write a program using python that reads from values from a text
file and plots them...
asked 1 hour ago -
Look up the density of
the metal of the object used in parts A and B...
asked 1 hour ago -
Discuss strategic considerations that Amazon and NYC politicians
had. Analyze why the deal between Amazon and...
asked 1 hour ago