
Homework Answers
ans 1)
a)

b) there is a strong positive linear relationship between weight and height ,as the height increases weight of the individual increases.
c )

ans 2 )
a )

b) there is negative relationship between the millage and sales price
3)
a )
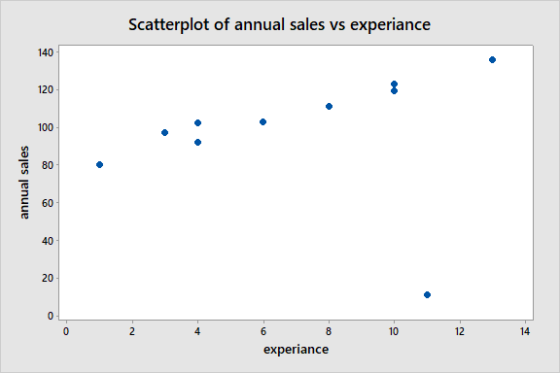
b ) there is a strong positive relationship between the annual sales and experiance as shown in the diagram
4 )
a)
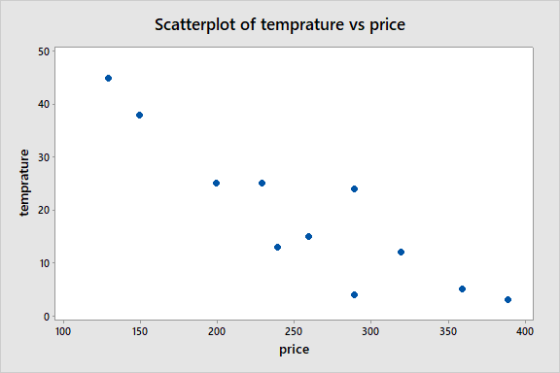
b ) there is strong negative relationship between the temperature and price as the temperature increase price decreases
5 )
a )

b ) there is moderate positive relationship between the weight and price
Add Answer to:
l Grameenphone 3G 7 37% 12:56 AM 1. Problems Related to Scatter Diagr... Problems Related to Scatter Diagram 1. The...
* 1 10 7 23 19 4450 4456 10 20 a. Choose the correct scatter diagram...
 * 1 10 7 23 19 4450 4456 10 20 a. Choose the correct scatter diagram for these data: ayl 60+ 10 20 30 40 50 60 10 20 30 40 50 60 Cy! 20. - 10 20 30 40 50 60 10 20 30 40 50 60 b. What does the scatter diagram developed in part (a) indicate about the relationship between the two variables? There appears to be a - Select your answer - linear relationship between 2...
and y Given are five observations for two variables, 7 20 17 13 29 13 48 52 58 a. Choose the correct scatter diagram f...
 and y Given are five observations for two variables, 7 20 17 13 29 13 48 52 58 a. Choose the correct scatter diagram for these data: B. 60- 60 50- 50 40 30- 30 20- 20 10- 10 40 60 x 50 30 60 v 20 10 4C 50 30 10 D C y y 60- 60 50- 50 40- 40 30- 30 60+ 60+ 50- 50- 40+ 40- 30+ 30- 20+ 20+ 10+ 10 10 20 30 40...
The following data given the percentage of women working in five companies in the retaul and...
 The following data given the percentage of women working in five companies in the retaul and trade industry. The percentage of management jobs held by women in each company is also shown. % Working 67 45 73 54 61 % 49 21 65 47 33 Management a. Develop a scatter diagram for these data with the percentage of women working in the company as the independent variable. b. What does the scatter diagram developed in part (a) indicate about the...
a. Which of the following scatter diagrams accurately represents the data? +16 +12 +8 0,5 0,5...
 a. Which of the following scatter diagrams accurately represents the data? +16 +12 +8 0,5 0,5 1 1,5 7.-2,5.....3,5...4...4,5. 5. 5,5. X Scatter diagram 82 b. What does the scatter diagram indicate about the relationship between the two variables? There appears to be a linear relationship between x and y c. Try to approximate the relationship between I and y by drawing a straight line through the data. The input in the box below will not be graded, but may...
To identify high-paying jobs for people that do not like stress, the following data were collected...
 To identify high-paying jobs for people that do not like stress,
the following data were collected showing the average annual salary
($1000) and the stress tolerance for a variety of occupations
(Business Insider, November 8, 2013).
The stress tolerance for each job is rated on a scale from 0 to
100, where a lower rating indicates less stress.
Click on the datafile logo to reference the data.
a. Select a scatter diagram for these data with
average annual salary as...
To identify high-paying jobs for people that do not like stress,
the following data were collected showing the average annual salary
($1000) and the stress tolerance for a variety of occupations
(Business Insider, November 8, 2013).
The stress tolerance for each job is rated on a scale from 0 to
100, where a lower rating indicates less stress.
Click on the datafile logo to reference the data.
a. Select a scatter diagram for these data with
average annual salary as...
Many countries, especially those in Burope, have significant gold holdings.
 Many countries, especially those in Burope, have significant gold holdings. But many of these countries also have massive debts. The following data show the total value of gold holdings in billions of U.S. dollars and the debt as a percentage of the gross domestic product for nine countries (WordPress and Trading Economics websites, February 24, 2012).a. Develop a scatter diagram for the total value of a country's gold holdings ($ billions) as the independent variable. b. What does the scatter diagram...
DATAe: Computer To help consumers in purchasing a laptop computer, Consumer Reports calculates an overall test...
 DATAe: Computer To help consumers in purchasing a laptop computer, Consumer Reports calculates an overall test score for each computer tested based upon rating factors such as ergonomics, portability, performance, dsplay, and battery life. Higher overall scores indicate better test results. The following data show the average retail price and the overall score for ten 13-inch models. Overal Score Brand & Model Price ($) Samsung Ultrabook NP900X3C-A01us 1,250 83 Apple MacBook Air MC965LL/A 1,300 83 Apple MacBook Air MD231LL/A 1,200...
show work please 56. Five observations taken for two variables follow. x 6 11 15 21...
 show work please
56. Five observations taken for two variables follow. x 6 11 15 21 27 y, 6 9 6 17 12 a. Develop a scatter diagram for these data. b. What does the scatter diagram indicate about a relationship between x and y? c. Compute and interpret the sample covariance. d. Compute and interpret the sample correlation coefficient
show work please
56. Five observations taken for two variables follow. x 6 11 15 21 27 y, 6 9 6 17 12 a. Develop a scatter diagram for these data. b. What does the scatter diagram indicate about a relationship between x and y? c. Compute and interpret the sample covariance. d. Compute and interpret the sample correlation coefficient
Answers and equations wpuld be the easiest way for me to understand it. Question 1. (5...
 Answers and equations wpuld be the easiest way for me to
understand it.
Question 1. (5 points) Given are five observations for two variables, Xi and X 3 14 12 620 yi 55 40 55 10 Develop a scatter diagram for these data. (1 point) b. What does the scatter diagram developed in part (a) indicate about the relationship between the two variables? (1 point) c. Try to approximate the relationship between x and y by drawing a straight line...
Answers and equations wpuld be the easiest way for me to
understand it.
Question 1. (5 points) Given are five observations for two variables, Xi and X 3 14 12 620 yi 55 40 55 10 Develop a scatter diagram for these data. (1 point) b. What does the scatter diagram developed in part (a) indicate about the relationship between the two variables? (1 point) c. Try to approximate the relationship between x and y by drawing a straight line...
aren 8, 2012) rer these data In eerose 20, data on x-weght(pounds) and y-price ($) for...
 aren 8, 2012) rer these data In eerose 20, data on x-weght(pounds) and y-price ($) for ten roed-racing bikes provided the estimated regression equation SSE 7,102,922.54 and SST-52,120,800. Use the F test to determine whether the weight for data -28574-1435xくBicycling website, M a bike and the price are related at the 05 level of significance. Click on the webfile logo to reference the WEB Calculate the value of the test stotistic (to 1 decimal) 1.4 The p value is ess...
 * 1 10 7 23 19 4450 4456 10 20 a. Choose the correct scatter diagram for these data: ayl 60+ 10 20 30 40 50 60 10 20 30 40 50 60 Cy! 20. - 10 20 30 40 50 60 10 20 30 40 50 60 b. What does the scatter diagram developed in part (a) indicate about the relationship between the two variables? There appears to be a - Select your answer - linear relationship between 2...
 and y Given are five observations for two variables, 7 20 17 13 29 13 48 52 58 a. Choose the correct scatter diagram for these data: B. 60- 60 50- 50 40 30- 30 20- 20 10- 10 40 60 x 50 30 60 v 20 10 4C 50 30 10 D C y y 60- 60 50- 50 40- 40 30- 30 60+ 60+ 50- 50- 40+ 40- 30+ 30- 20+ 20+ 10+ 10 10 20 30 40...
 The following data given the percentage of women working in five companies in the retaul and trade industry. The percentage of management jobs held by women in each company is also shown. % Working 67 45 73 54 61 % 49 21 65 47 33 Management a. Develop a scatter diagram for these data with the percentage of women working in the company as the independent variable. b. What does the scatter diagram developed in part (a) indicate about the...
 a. Which of the following scatter diagrams accurately represents the data? +16 +12 +8 0,5 0,5 1 1,5 7.-2,5.....3,5...4...4,5. 5. 5,5. X Scatter diagram 82 b. What does the scatter diagram indicate about the relationship between the two variables? There appears to be a linear relationship between x and y c. Try to approximate the relationship between I and y by drawing a straight line through the data. The input in the box below will not be graded, but may...
 To identify high-paying jobs for people that do not like stress,
the following data were collected showing the average annual salary
($1000) and the stress tolerance for a variety of occupations
(Business Insider, November 8, 2013).
The stress tolerance for each job is rated on a scale from 0 to
100, where a lower rating indicates less stress.
Click on the datafile logo to reference the data.
a. Select a scatter diagram for these data with
average annual salary as...
To identify high-paying jobs for people that do not like stress,
the following data were collected showing the average annual salary
($1000) and the stress tolerance for a variety of occupations
(Business Insider, November 8, 2013).
The stress tolerance for each job is rated on a scale from 0 to
100, where a lower rating indicates less stress.
Click on the datafile logo to reference the data.
a. Select a scatter diagram for these data with
average annual salary as...
 DATAe: Computer To help consumers in purchasing a laptop computer, Consumer Reports calculates an overall test score for each computer tested based upon rating factors such as ergonomics, portability, performance, dsplay, and battery life. Higher overall scores indicate better test results. The following data show the average retail price and the overall score for ten 13-inch models. Overal Score Brand & Model Price ($) Samsung Ultrabook NP900X3C-A01us 1,250 83 Apple MacBook Air MC965LL/A 1,300 83 Apple MacBook Air MD231LL/A 1,200...
 show work please
56. Five observations taken for two variables follow. x 6 11 15 21 27 y, 6 9 6 17 12 a. Develop a scatter diagram for these data. b. What does the scatter diagram indicate about a relationship between x and y? c. Compute and interpret the sample covariance. d. Compute and interpret the sample correlation coefficient
show work please
56. Five observations taken for two variables follow. x 6 11 15 21 27 y, 6 9 6 17 12 a. Develop a scatter diagram for these data. b. What does the scatter diagram indicate about a relationship between x and y? c. Compute and interpret the sample covariance. d. Compute and interpret the sample correlation coefficient
 Answers and equations wpuld be the easiest way for me to
understand it.
Question 1. (5 points) Given are five observations for two variables, Xi and X 3 14 12 620 yi 55 40 55 10 Develop a scatter diagram for these data. (1 point) b. What does the scatter diagram developed in part (a) indicate about the relationship between the two variables? (1 point) c. Try to approximate the relationship between x and y by drawing a straight line...
Answers and equations wpuld be the easiest way for me to
understand it.
Question 1. (5 points) Given are five observations for two variables, Xi and X 3 14 12 620 yi 55 40 55 10 Develop a scatter diagram for these data. (1 point) b. What does the scatter diagram developed in part (a) indicate about the relationship between the two variables? (1 point) c. Try to approximate the relationship between x and y by drawing a straight line...
 aren 8, 2012) rer these data In eerose 20, data on x-weght(pounds) and y-price ($) for ten roed-racing bikes provided the estimated regression equation SSE 7,102,922.54 and SST-52,120,800. Use the F test to determine whether the weight for data -28574-1435xくBicycling website, M a bike and the price are related at the 05 level of significance. Click on the webfile logo to reference the WEB Calculate the value of the test stotistic (to 1 decimal) 1.4 The p value is ess...
Most questions answered within 3 hours.
-
Please answer true or false. Words
cannot be changed or added in to make it true...
asked 47 minutes ago -
An empty test tube weighs 15.923 grams. Then,
MgCl2•6H2O is added into the test tube. After...
asked 49 minutes ago -
(a) A piston at 6.1 atm contains a gas that occupies a volume of
3.5 L....
asked 48 minutes ago -
Assume memory access is 10 units of time and disk access is
10000 units of time....
asked 1 hour ago -
1. Are all good samples random?
2. Magazines often report surveys giving statistics such as “63%...
asked 1 hour ago -
Under all the various types of market structures, firms
must eventually earn some economic profits for...
asked 1 hour ago -
Consider the following fitness regime for a single locus trait
with two co-dominant alleles: w11 =...
asked 1 hour ago -
A large cable company reports the following.
80% of its customers subscribe to its cable TV...
asked 1 hour ago -
Please answer the question in brief.
Discuss the role of ERP in organizations. Are ERP tools...
asked 1 hour ago -
Discuss the pros and cons of collaborative software such
as SameTime. Does it increase productivity? What...
asked 1 hour ago -
Buying your in-laws a gift because it’s expected is
due to the ____________ motive of gift-giving....
asked 1 hour ago -
Calculate the expected value, the variance, and the standard
deviation of the given random variable X....
asked 2 hours ago