Many countries, especially those in Burope, have significant gold holdings.
Many countries, especially those in Burope, have significant gold holdings. But many of these countries also have massive debts. The following data show the total value of gold holdings in billions of U.S. dollars and the debt as a percentage of the gross domestic product for nine countries (WordPress and Trading Economics websites, February 24, 2012).

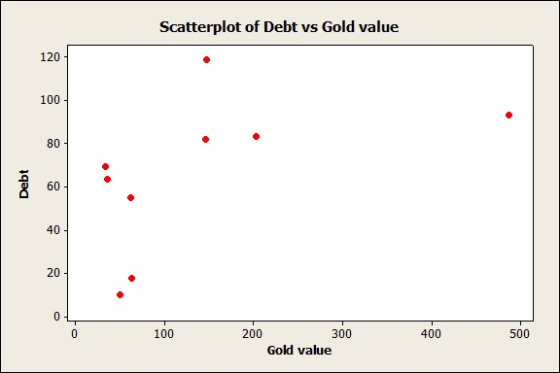
a. Develop a scatter diagram for the total value of a country's gold holdings ($ billions) as the independent variable.
b. What does the scatter diagram developed in part (a) indicate about the relationship between the two variables? Does there appear to be any outliers and/or influential observations? Explain.
c. Using the entire data set, develop the estimated regression equation that can be used to predict the debt of a country given the total value of its gold holdings.
d. Suppose that after looking at the scatter diagram in part (a) that you were able to visually identify what appears to be an influential observation. Drop this observation from the data set and fit an estimated regression equation to the remaining data. Compare the estimated slope for the new estimated regression equation to the estimated slope obtained in part (c). Does this approach confirm the conclusion you reached in part (d)? Explain
Homework Answers
a)
b)
The scatter diagram in a) indicate a positive relationship between the variables Gold value and Debt. Also, there appears to be an outlier or influential observation by the value (487, 93.2).
c)

b) After dropping the outlier values (487, 93.2) looking in scatter plot a), the estimated regression model is

Comparing the slope from the c) fitting in original data, the slope estimated after dropping the outlier is bigger.
But the prediction of Debt using the Gold values does not have a significant effect at 0.05 level of significance at both c) and d). Because the estimated p-values of the slope in original and dropping outlier are more than 0.05 level of significance.
Add Answer to:
Many countries, especially those in Burope, have significant gold holdings.
Please answer correctly or don’t answer at all thank you have signhicant gold holdings. But many...
 Please answer correctly or don’t answer at all thank you
have signhicant gold holdings. But many of these countries also have massive debes The following dats show the total value of product for nine countries (WondPress and Trading Economics websites, February especialily those in Europe, Many countrie 24, 2012) Cick on the datafile loge to reference the data DATA Gold Country 17.7 Prance Germany Indonesia 132 692 62 .Select for the total value of a country's gold holdings( bitions) as...
Please answer correctly or don’t answer at all thank you
have signhicant gold holdings. But many of these countries also have massive debes The following dats show the total value of product for nine countries (WondPress and Trading Economics websites, February especialily those in Europe, Many countrie 24, 2012) Cick on the datafile loge to reference the data DATA Gold Country 17.7 Prance Germany Indonesia 132 692 62 .Select for the total value of a country's gold holdings( bitions) as...
Consider the following data for two variables, x and y.
 Consider the following data for two variables, x and y. a. Choose the correct scatter diagram with x and y. The correct scatter diagram is - _______ . Does there appear to be a linear relationship between x and y? Explain. The scatter diagram- Select your answer - some evidence of a possible linear relationship. b. Develop the estimated regression equation relating x and y. Save "predicted" and "residuals" (to 4 decimals). c. Choose the correct scatter diagram or the residuals versus y tor the estimated...
Given are five observations for two variables, x and y. xi 1 2 3 4 5...
Given are five observations for two variables, x and y. xi 1 2 3 4 5 yi 3 7 8 11 14 Which of the following scatter diagrams accurately represents the data? 1. 2. 3. SelectScatter diagram #1Scatter diagram #2Scatter diagram #3Item 1 What does the scatter diagram indicate about the relationship between the two variables? SelectThere appears to be a linear relationship between x and yThere appears to be a nonlinear relationship between x and yItem 2 Try to...
please help An important application of regression analysis in accounting is in the estimation of cost....
 please help
An important application of regression analysis in accounting is in the estimation of cost. By collecting data on volume and cost and using the least squares method to develop an estimated regression equation relating volume and cost, an accountant can estimate the cost associated with a particular manufacturing volume. Consider the following sample of production volumes and total cost data for a manufacturing operation. Total Cost Production Volume (units) 400 4,000 450 5,100 550 5,300 600 5,800 700...
please help
An important application of regression analysis in accounting is in the estimation of cost. By collecting data on volume and cost and using the least squares method to develop an estimated regression equation relating volume and cost, an accountant can estimate the cost associated with a particular manufacturing volume. Consider the following sample of production volumes and total cost data for a manufacturing operation. Total Cost Production Volume (units) 400 4,000 450 5,100 550 5,300 600 5,800 700...
Can you please assist with this problem? An important application of regression analysis in accounting is...
 Can you please assist with this problem?
An important application of regression analysis in accounting is in the estimation of cost. By collecting data on volume and cost and using the least squares method to develop an estimated regression equation relating volume and cost, an accountant can estimate the cost associated with a particular manufacturing volume. Consider the following sample of production voures and total cost data for a manufacturing operation Production Volume (units) Total Cost ($) 400 4,000 450...
Can you please assist with this problem?
An important application of regression analysis in accounting is in the estimation of cost. By collecting data on volume and cost and using the least squares method to develop an estimated regression equation relating volume and cost, an accountant can estimate the cost associated with a particular manufacturing volume. Consider the following sample of production voures and total cost data for a manufacturing operation Production Volume (units) Total Cost ($) 400 4,000 450...
Starting salaries for accountants in Tampa follow those of many U.S. cities. The table bellow shows...
Starting salaries for accountants in Tampa follow those of many U.S. cities. The table bellow shows starting salaries (in thousands of dollars) and the cost of living index for 5 metropolitan areas. A regression analysis will help provide explanation on how cost of living explains salary in this sample. Salary in Thousands $ (2pt) Explain the relationship of cost of living and salary According to what is shown in the scatter diagram. Cost of Living Index (8pt)Use the least...
A statistical program is recommended. Consider the following data for two variables, x and y. x...
A statistical program is recommended. Consider the following data for two variables, x and y. x 22 24 26 30 35 40 y 13 20 33 35 40 36 (a) Develop an estimated regression equation for the data of the form ŷ = b0 + b1x. (Round b0 to one decimal place and b1 to three decimal places.) ŷ = (b) Use the results from part (a) to test for a significant relationship between x and y. Use α =...
The National Football League (NFL) records a variety of performance data for Individuals and team...
 The National Football League (NFL) records a variety of performance data for Individuals and teams. To investigate the importance of passing on the percentage of games won by a team, the following data show the average number of passing yards per attempt (Yds/Att) and the percentage of games won (Win96) for a random sample of 10 NFL teams. Team Team 1 Team 2 Team 3 Team 4 Team 5 Team б Team 7 Team 8 Team 9 Team 10 Yds/Att...
Please show instructions on how you got the answer. Thank you. Question 1: Question 2: Given...
 Please show instructions on how you got the answer. Thank
you.
Question 1:
Question 2:
Given are five observations for two variables, x and y. 1 2 3 4 (a) Develop a scatter diagram for these data. (b) What does the scatter diagram developed in part (a) indicate about the relationship between the two variables? There appears to be a negative linear relationship between x and y. There appears to be a positive linear relationship between x and y. There...
Please show instructions on how you got the answer. Thank
you.
Question 1:
Question 2:
Given are five observations for two variables, x and y. 1 2 3 4 (a) Develop a scatter diagram for these data. (b) What does the scatter diagram developed in part (a) indicate about the relationship between the two variables? There appears to be a negative linear relationship between x and y. There appears to be a positive linear relationship between x and y. There...
Answers and equations wpuld be the easiest way for me to understand it. Question 1. (5...
 Answers and equations wpuld be the easiest way for me to
understand it.
Question 1. (5 points) Given are five observations for two variables, Xi and X 3 14 12 620 yi 55 40 55 10 Develop a scatter diagram for these data. (1 point) b. What does the scatter diagram developed in part (a) indicate about the relationship between the two variables? (1 point) c. Try to approximate the relationship between x and y by drawing a straight line...
Answers and equations wpuld be the easiest way for me to
understand it.
Question 1. (5 points) Given are five observations for two variables, Xi and X 3 14 12 620 yi 55 40 55 10 Develop a scatter diagram for these data. (1 point) b. What does the scatter diagram developed in part (a) indicate about the relationship between the two variables? (1 point) c. Try to approximate the relationship between x and y by drawing a straight line...
 Please answer correctly or don’t answer at all thank you
have signhicant gold holdings. But many of these countries also have massive debes The following dats show the total value of product for nine countries (WondPress and Trading Economics websites, February especialily those in Europe, Many countrie 24, 2012) Cick on the datafile loge to reference the data DATA Gold Country 17.7 Prance Germany Indonesia 132 692 62 .Select for the total value of a country's gold holdings( bitions) as...
Please answer correctly or don’t answer at all thank you
have signhicant gold holdings. But many of these countries also have massive debes The following dats show the total value of product for nine countries (WondPress and Trading Economics websites, February especialily those in Europe, Many countrie 24, 2012) Cick on the datafile loge to reference the data DATA Gold Country 17.7 Prance Germany Indonesia 132 692 62 .Select for the total value of a country's gold holdings( bitions) as...
 please help
An important application of regression analysis in accounting is in the estimation of cost. By collecting data on volume and cost and using the least squares method to develop an estimated regression equation relating volume and cost, an accountant can estimate the cost associated with a particular manufacturing volume. Consider the following sample of production volumes and total cost data for a manufacturing operation. Total Cost Production Volume (units) 400 4,000 450 5,100 550 5,300 600 5,800 700...
please help
An important application of regression analysis in accounting is in the estimation of cost. By collecting data on volume and cost and using the least squares method to develop an estimated regression equation relating volume and cost, an accountant can estimate the cost associated with a particular manufacturing volume. Consider the following sample of production volumes and total cost data for a manufacturing operation. Total Cost Production Volume (units) 400 4,000 450 5,100 550 5,300 600 5,800 700...
 Can you please assist with this problem?
An important application of regression analysis in accounting is in the estimation of cost. By collecting data on volume and cost and using the least squares method to develop an estimated regression equation relating volume and cost, an accountant can estimate the cost associated with a particular manufacturing volume. Consider the following sample of production voures and total cost data for a manufacturing operation Production Volume (units) Total Cost ($) 400 4,000 450...
Can you please assist with this problem?
An important application of regression analysis in accounting is in the estimation of cost. By collecting data on volume and cost and using the least squares method to develop an estimated regression equation relating volume and cost, an accountant can estimate the cost associated with a particular manufacturing volume. Consider the following sample of production voures and total cost data for a manufacturing operation Production Volume (units) Total Cost ($) 400 4,000 450...
 The National Football League (NFL) records a variety of performance data for Individuals and teams. To investigate the importance of passing on the percentage of games won by a team, the following data show the average number of passing yards per attempt (Yds/Att) and the percentage of games won (Win96) for a random sample of 10 NFL teams. Team Team 1 Team 2 Team 3 Team 4 Team 5 Team б Team 7 Team 8 Team 9 Team 10 Yds/Att...
 Please show instructions on how you got the answer. Thank
you.
Question 1:
Question 2:
Given are five observations for two variables, x and y. 1 2 3 4 (a) Develop a scatter diagram for these data. (b) What does the scatter diagram developed in part (a) indicate about the relationship between the two variables? There appears to be a negative linear relationship between x and y. There appears to be a positive linear relationship between x and y. There...
Please show instructions on how you got the answer. Thank
you.
Question 1:
Question 2:
Given are five observations for two variables, x and y. 1 2 3 4 (a) Develop a scatter diagram for these data. (b) What does the scatter diagram developed in part (a) indicate about the relationship between the two variables? There appears to be a negative linear relationship between x and y. There appears to be a positive linear relationship between x and y. There...
 Answers and equations wpuld be the easiest way for me to
understand it.
Question 1. (5 points) Given are five observations for two variables, Xi and X 3 14 12 620 yi 55 40 55 10 Develop a scatter diagram for these data. (1 point) b. What does the scatter diagram developed in part (a) indicate about the relationship between the two variables? (1 point) c. Try to approximate the relationship between x and y by drawing a straight line...
Answers and equations wpuld be the easiest way for me to
understand it.
Question 1. (5 points) Given are five observations for two variables, Xi and X 3 14 12 620 yi 55 40 55 10 Develop a scatter diagram for these data. (1 point) b. What does the scatter diagram developed in part (a) indicate about the relationship between the two variables? (1 point) c. Try to approximate the relationship between x and y by drawing a straight line...
Most questions answered within 3 hours.
-
5. Suppose you obtained 0.55 g of crude clove oil from 7.0 g of
fresh cloves....
asked 6 minutes ago -
Provide a paragraph of introduction that generally describes
cognitive development over the lifespan.
asked 10 minutes ago -
In a market, when the price increased the total expenditure on
the good also increased. Is...
asked 10 minutes ago -
If 5.70 g of potassium react with water, how many grams of
hydrogen gas, H2, are...
asked 24 minutes ago -
How many moles of CO2 and H2O will be
produced by combustion analysis of 0.010 mol...
asked 22 minutes ago -
Tennis champion Maria Sharapova is capable of serving a tennis
ball at 126 mph.
b) What...
asked 30 minutes ago -
The electric potential V in the space between the plates of a
given vacuum tube is...
asked 40 minutes ago -
The Hydroboration-Oxidation of an Alkene to Yield 1-Octanol.
1-octene to 1-octanol using BH3-THF
What might be...
asked 45 minutes ago -
You draw and keep a single bill from a hat that contains a
$11, $55, $20...
asked 1 hour ago -
Write a Java program that has the following methods:
findSum - a method that takes in...
asked 1 hour ago -
A coffee cup calorimeter initially contains 135g of water at
22.0oC. Calcium chloride (21.0g) at the...
asked 1 hour ago -
A patient is having a magnetic resonance imaging scan (an MRI)
and has neglected to remove...
asked 1 hour ago